OPEN-SOURCE SCRIPT
Stock Valuation Models - Professional Investment Analysis Tool
📊 Overview
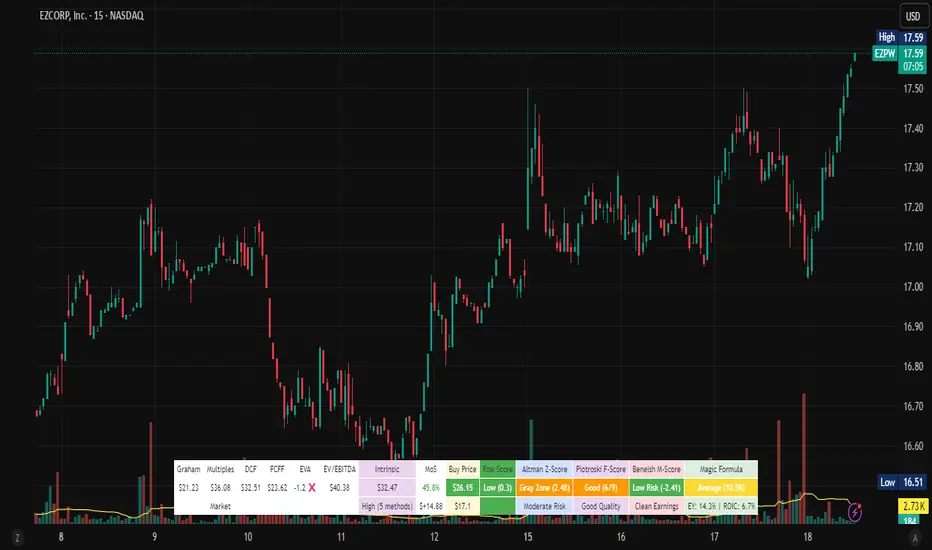
Stock Valuation Models is a comprehensive financial analysis indicator that combines multiple valuation methodologies to calculate intrinsic stock value. This professional-grade tool implements 7 different valuation methods, risk assessment framework, and financial health metrics to provide data-driven investment decisions.
🎯 Key Features
📈 Multiple Valuation Methods
🏥 Financial Health Metrics
⚖️ Risk Assessment Framework
🔍 Data Quality System
⚙️ Settings & Parameters
Main Settings
Valuation Methods
Additional Metrics
🔧 How It Works
Dynamic Calculations
Risk-Adjusted Analysis
Visual Display
📈 Interpretation Guide
💎 Intrinsic Value Results
🎯 Margin of Safety
⚖️ Risk Assessment
📊 Recommendations
🎓 Educational Tooltips
Every parameter includes detailed explanations accessible by hovering over the setting. Learn about:
💡 Best Practices
🚀 For Growth Stocks
💰 For Value Stocks
📈 For Dividend Stocks
⚠️ For Distressed Situations
⚠️ Important Notes & Data Limitations
🔧 Technical Limitations
💡 Best Practice Recommendations
🔗 Methodology
Based on established academic research and professional practices:
This indicator is designed for educational and analytical purposes. Always conduct additional research and consider consulting with financial professionals before making investment decisions.
Stock Valuation Models is a comprehensive financial analysis indicator that combines multiple valuation methodologies to calculate intrinsic stock value. This professional-grade tool implements 7 different valuation methods, risk assessment framework, and financial health metrics to provide data-driven investment decisions.
🎯 Key Features
📈 Multiple Valuation Methods
- Graham's Valuation - Conservative asset-based approach by Benjamin Graham
- Multiples Valuation - Market-based P/E and P/B ratios from sector peers
- Discounted Cash Flow (DCF) - Future cash flow projections with present value calculation
- Dividend Discount Model - Gordon Growth Model for dividend-paying stocks
- FCFF Model - Enterprise-level Free Cash Flow to Firm analysis
- EVA Model - Economic Value Added measurement above cost of capital
- Advanced Multiples - Enterprise Value ratios (EV/EBITDA, EV/Sales)
🏥 Financial Health Metrics
- Altman Z-Score - Bankruptcy prediction and financial distress assessment
- Piotroski F-Score - 9-point fundamental strength evaluation
- Beneish M-Score - Earnings manipulation detection system
- Magic Formula - Joel Greenblatt's combined quality and value scoring
⚖️ Risk Assessment Framework
- Multi-Factor Risk Scoring - Fundamental, market, quality, and data quality risks
- Risk-Adjusted Margin of Safety - Dynamic safety thresholds based on risk level
- Position Sizing Guidance - Risk-appropriate investment allocation recommendations
🔍 Data Quality System
- Real-Time Quality Tracking - Visual warnings for insufficient data
- Fallback Methodology - Alternative calculations when primary data unavailable
- Confidence Scoring - Method agreement and data quality assessment
⚙️ Settings & Parameters
Main Settings
- Margin of Safety (%) - Minimum discount required before buying (Default: 15%)
- Table Font Size - Choose between "Small" and "Normal" text size
Valuation Methods
- Graham's Valuation - Best for mature, stable companies with strong fundamentals
- Multiples Valuation - Compares to industry peers using dynamic sector ratios
- Discounted Cash Flow - Ideal for growth companies with predictable cash flows
- Dividend Discount Model - For consistent dividend-paying stocks (disabled by default)
- FCFF Model - Enterprise approach for leveraged companies and M&A analysis
- EVA Model - Measures value creation above cost of capital
- Advanced Multiples - Wall Street standard EV ratios for professional analysis
Additional Metrics
- Magic Formula - Combined quality and value scoring system
- Altman Z-Score - Bankruptcy risk assessment (Safe >2.99, Distress <1.81)
- Piotroski F-Score - Fundamental quality score (Excellent ≥8, Poor <4)
- Beneish M-Score - Manipulation detector (High Risk >-2.22, Low Risk ≤-2.22)
🔧 How It Works
Dynamic Calculations
- Sector-Based Ratios - Automatically detects company sector and applies appropriate valuation multiples
- Economic Integration - Uses real-time risk-free rates, VIX volatility, and GDP growth data
- Quality Weighting - Adjusts method weights based on company type (growth/mature/distressed) and market conditions
- Negative Value Handling - Shows actual calculated values but excludes negative results from weighted average
Risk-Adjusted Analysis
- VIX Integration - Higher market volatility increases required margin of safety
- Sector Risk Premiums - Energy and Financial sectors get higher risk multipliers
- Quality Adjustments - High Piotroski F-Score companies get lower risk ratings
- Data Quality Impact - Insufficient data increases risk score and safety requirements
Visual Display
- Horizontal Table Layout - Organized by method groups (Valuation → Results → Risk → Health)
- Color-Coded Results - Green/Yellow/Red indicators for risk levels and recommendations
- Warning Symbols - ⚠️ for data quality issues, ❌ for excluded negative values
- Dollar Amounts - Both percentage and dollar-based margin of safety calculations
📈 Interpretation Guide
💎 Intrinsic Value Results
- Weighted Average - Combines all enabled methods based on intelligent weighting
- Confidence Level - High/Medium/Low based on method agreement and data quality
- Method Count - Number of successful valuation calculations
🎯 Margin of Safety
- Percentage - Current discount/premium to calculated intrinsic value
- Dollar Amount - Absolute dollar difference per share
- Buy Price - Risk-adjusted target purchase price
⚖️ Risk Assessment
- Low Risk (Green) - Normal position sizing (3-5%)
- Medium Risk (Yellow) - Reduced position sizing (1-3%)
- High Risk (Red) - Minimal position sizing (<1%)
📊 Recommendations
- STRONG BUY - Low risk + adequate margin + high confidence
- BUY - Meets risk-adjusted margin requirements
- HOLD - Positive margin but higher risk
- SELL - Insufficient margin for risk level
🎓 Educational Tooltips
Every parameter includes detailed explanations accessible by hovering over the setting. Learn about:
- When to use each valuation method
- How different metrics are calculated
- Interpretation thresholds and ratings
- Risk factors and quality indicators
💡 Best Practices
🚀 For Growth Stocks
- Enable DCF and Advanced Multiples
- Focus on Piotroski F-Score for quality assessment
- Use higher margin of safety due to volatility
💰 For Value Stocks
- Enable Graham's and Multiples Valuation
- Check Altman Z-Score for financial stability
- Consider Magic Formula rating
📈 For Dividend Stocks
- Enable Dividend Discount Model
- Focus on sustainable dividend coverage
- Check for consistent dividend history
⚠️ For Distressed Situations
- Prioritize Graham's asset-based approach
- Monitor Altman Z-Score closely
- Use higher risk-adjusted margins
⚠️ Important Notes & Data Limitations
📅 Data Timing Considerations
Fundamental Data Lag - Company financial data (earnings, cash flows, balance sheet items) may be 1-3 months behind current market conditions
Quarterly Reporting Delays - Most recent available data reflects the company's situation as of the last filed quarterly/annual report
Market vs. Fundamentals Gap - Stock prices react instantly to news, while fundamental data updates occur periodically
Accuracy Impact - Recent business changes, market events, or company developments may not be reflected in current calculations
🔧 Technical Limitations
- Data Dependencies - Requires fundamental data availability from TradingView
- Quality Warnings - Pay attention to ⚠️ symbols indicating insufficient data
- Risk Context - Always consider risk score in investment decisions
- Market Conditions - Tool automatically adjusts for market volatility (VIX)
- Sector Specificity - Ratios automatically adjust based on company's sector
💡 Best Practice Recommendations
- Supplement with Current Analysis - Always combine with recent news, earnings calls, and management guidance
- Monitor Data Quality - Check when the underlying financial data was last updated
- Consider Market Context - Factor in recent market events that may affect company performance
- Use as Starting Point - Treat calculations as baseline analysis requiring additional research
🔗 Methodology
Based on established academic research and professional practices:
- Benjamin Graham - Security Analysis principles
- Joel Greenblatt - Magic Formula methodology
- Edward Altman - Z-Score bankruptcy prediction
- Joseph Piotroski - Fundamental analysis scoring
- Messod Beneish - Earnings manipulation detection
- Modern Portfolio Theory - Risk-adjusted decision making
This indicator is designed for educational and analytical purposes. Always conduct additional research and consider consulting with financial professionals before making investment decisions.
สคริปต์โอเพนซอร์ซ
ด้วยเจตนารมณ์หลักของ TradingView ผู้สร้างสคริปต์นี้ได้ทำให้เป็นโอเพนซอร์ส เพื่อให้เทรดเดอร์สามารถตรวจสอบและยืนยันฟังก์ชันการทำงานของมันได้ ขอชื่นชมผู้เขียน! แม้ว่าคุณจะใช้งานได้ฟรี แต่โปรดจำไว้ว่าการเผยแพร่โค้ดซ้ำจะต้องเป็นไปตาม กฎระเบียบการใช้งาน ของเรา
คำจำกัดสิทธิ์ความรับผิดชอบ
ข้อมูลและบทความไม่ได้มีวัตถุประสงค์เพื่อก่อให้เกิดกิจกรรมทางการเงิน, การลงทุน, การซื้อขาย, ข้อเสนอแนะ หรือคำแนะนำประเภทอื่น ๆ ที่ให้หรือรับรองโดย TradingView อ่านเพิ่มเติมใน ข้อกำหนดการใช้งาน