PINE LIBRARY
ที่อัปเดต: DrawIndicatorOnTheChart

Library "DrawIndicatorOnTheChart"
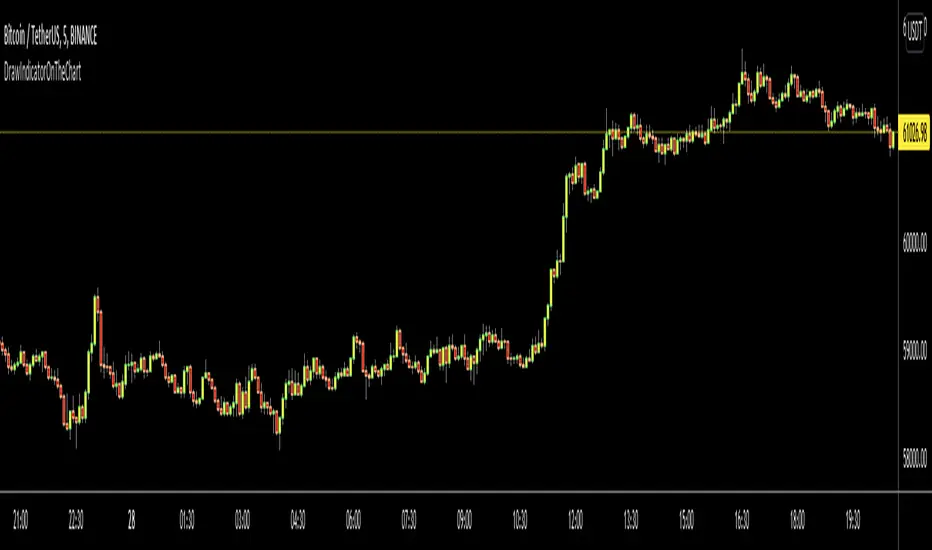
this library is used to show an indicator (such RSI, CCI, MOM etc) on the main chart with indicator's horizontal lines in a window. Location of the window is calculated dynamically by last price movemements
drawIndicator(indicatorName, indicator, indicatorcolor, period, indimax_, indimin_, levels, precision, xlocation) draws the related indicator on the chart
Parameters:
indicatorName: is the indicator name as string such "RSI", "CCI" etc
indicator: is the indicator you want to show, such rsi(close, 14), mom(close, 10) etc
indicatorcolor: is the color of indicator line
period: is the length of the window to show
indimax_: is the maximum value of the indicator, for example for RSI it's 100.0, if the indicator (such CCI, MOM etc) doesn't have maximum value then use "na"
indimin_: is the minimum value of the indicator, for example for RSI it's 0.0, if the indicator (such CCI, MOM etc)doesn't have maximum value then use "na"
levels: is the levels of the array for the horizontal lines. for example if you want horizontal lines at 30.0, and 70.0 then use array.from(30.0, 70.0). if no horizontal lines then use array.from(na)
precision: is the precision/number of decimals that is used to show indicator values, for example for RSI set it 2
xlocation: is end location of the indicator window, for example if xlocation = 0 window is created on the index of the last bar/candle
Returns: none
เอกสารเผยแพร่
v2background color of the window changed as black
เอกสารเผยแพร่
v3เอกสารเผยแพร่
v4เอกสารเผยแพร่
v5: - updated to show multiple indicator lines for the indicators such DMI
- so indicator parameter changed to indicator1, indicator2, indicator3 (if indicator2 or indicator3 doesn't exist then send na value)
- added line width parameter
- color parameter changed to the array
Updated:
drawIndicator(enabled, indicatorName, indicator1, indicator2, indicator3, indicatorcolor, period, indimax_, indimin_, levels, precision, xlocation, lnwidth) draws the related indicator on the chart
Parameters:
enabled: if it's enabled to show
indicatorName: is the indicator name as string such "RSI", "CCI" etc
indicator1: is first indicator you want to show, such rsi(close, 14), mom(close, 10) etc
indicator2: is second indicator you want to show, such -DI of DMI
indicator3: is third indicator you want to show, such ADX of DMI
indicatorcolor: is the color of indicator line
period: is the length of the window to show
indimax_: is the maximum value of the indicator, for example for RSI it's 100.0, if the indicator (such CCI, MOM etc) doesn't have maximum value then use "na"
indimin_: is the minimum value of the indicator, for example for RSI it's 0.0, if the indicator (such CCI, MOM etc)doesn't have maximum value then use "na"
levels: is the levels of the array for the horizontal lines. for example if you want horizontal lines at 30.0, and 70.0 then use array.from(30.0, 70.0). if no horizontal lines then use array.from(na)
precision: is the precision/nuber of decimals that is used to show indicator values, for example for RSI set it 2
xlocation: is end location of the indicator window, for example if xlocation = 0 window is created on the index of the last bar/candle
lnwidth: is the line width of the indicator lines
Returns: none
เอกสารเผยแพร่
v6Somehow indicator doesn't show the lines. fixed. Thank to TanHef for the solution
ไลบรารีไพน์
ด้วยเจตนารมณ์หลักของ TradingView ผู้เขียนได้เผยแพร่ Pine code นี้เป็นโอเพนซอร์สไลบรารีเพื่อให้ Pine โปรแกรมเมอร์คนอื่นในชุมชนของเราสามารถนำไปใช้ซ้ำได้ ต้องขอบคุณผู้เขียน! คุณสามารถใช้ไลบรารีนี้ในแบบส่วนตัวหรือในการเผยแพร่แบบโอเพนซอร์สอื่น ๆ แต่การนำโค้ดนี้ไปใช้ในการเผยแพร่ซ้ำจะต้องอยู่ภายใต้ กฎระเบียบการใช้งาน
🤝 LonesomeTheBlue community
t.me/LonesomeTheBlue_Official
🎦 YouTube Channel
Youtube.com/@lonesometheblue/videos
💰 Subscription to Pro indicators
Tradingview.com/spaces/LonesomeTheBlue/
t.me/LonesomeTheBlue_Official
🎦 YouTube Channel
Youtube.com/@lonesometheblue/videos
💰 Subscription to Pro indicators
Tradingview.com/spaces/LonesomeTheBlue/
คำจำกัดสิทธิ์ความรับผิดชอบ
ข้อมูลและบทความไม่ได้มีวัตถุประสงค์เพื่อก่อให้เกิดกิจกรรมทางการเงิน, การลงทุน, การซื้อขาย, ข้อเสนอแนะ หรือคำแนะนำประเภทอื่น ๆ ที่ให้หรือรับรองโดย TradingView อ่านเพิ่มเติมใน ข้อกำหนดการใช้งาน