OPEN-SOURCE SCRIPT
ที่อัปเดต: BANKNIFTY list of stocks RSI trend on multi time frame
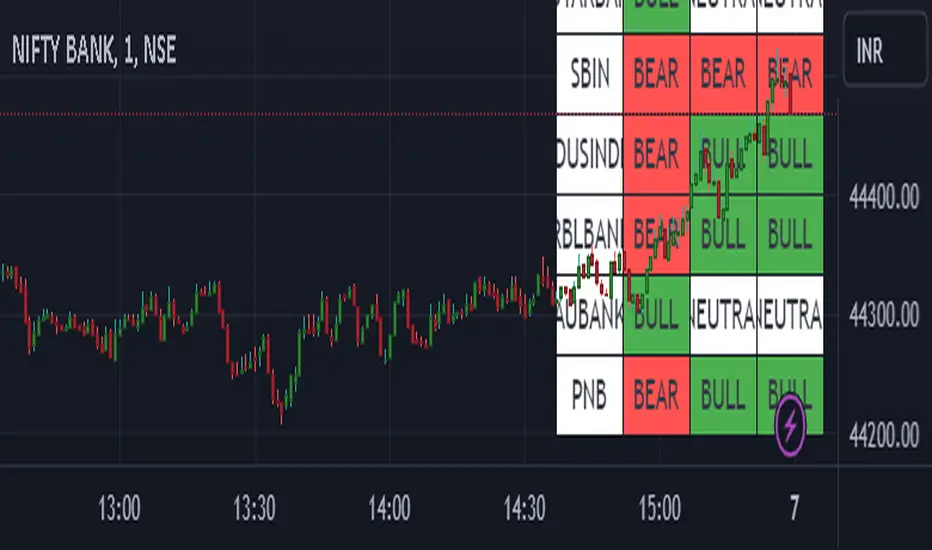
This script gives you an overview of banknifty and its underlying heavy weight stocks based on RSI
You can view the trend in single chart in 3 different time frames.
Color indication green for bullish and red for bearish trend and white for neutral
Symbol name shows green if the current day change is positive. Else red color
You can view the trend in single chart in 3 different time frames.
Color indication green for bullish and red for bearish trend and white for neutral
Symbol name shows green if the current day change is positive. Else red color
เอกสารเผยแพร่
Few users reported that the change of time is not reflecting correctly.Also removed the color for the first column as there was a restriction from TV
Enjoy the script
สคริปต์โอเพนซอร์ซ
ด้วยเจตนารมณ์หลักของ TradingView ผู้สร้างสคริปต์นี้ได้ทำให้เป็นโอเพนซอร์ส เพื่อให้เทรดเดอร์สามารถตรวจสอบและยืนยันฟังก์ชันการทำงานของมันได้ ขอชื่นชมผู้เขียน! แม้ว่าคุณจะใช้งานได้ฟรี แต่โปรดจำไว้ว่าการเผยแพร่โค้ดซ้ำจะต้องเป็นไปตาม กฎระเบียบการใช้งาน ของเรา
คำจำกัดสิทธิ์ความรับผิดชอบ
ข้อมูลและบทความไม่ได้มีวัตถุประสงค์เพื่อก่อให้เกิดกิจกรรมทางการเงิน, การลงทุน, การซื้อขาย, ข้อเสนอแนะ หรือคำแนะนำประเภทอื่น ๆ ที่ให้หรือรับรองโดย TradingView อ่านเพิ่มเติมใน ข้อกำหนดการใช้งาน