OPEN-SOURCE SCRIPT
High and Low of Last 5 Trading Days
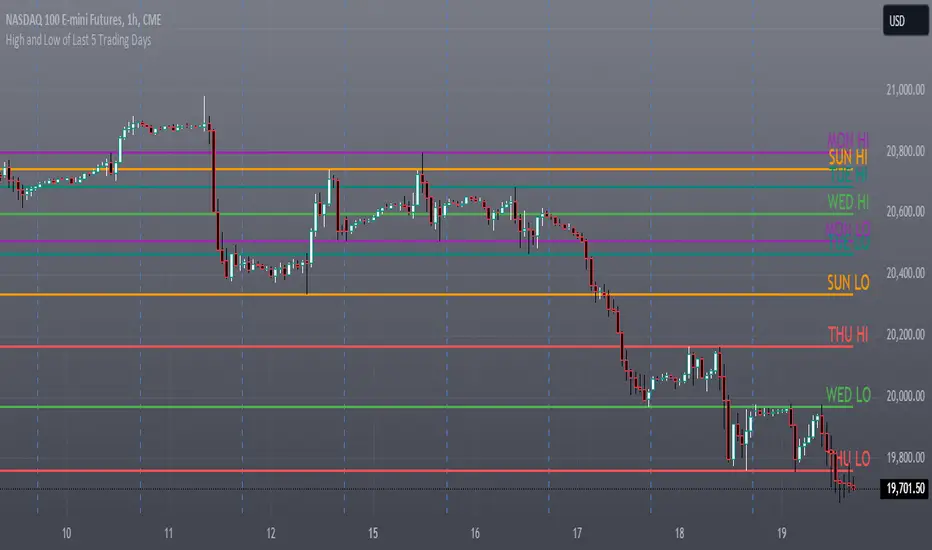
### Indicator Description: High and Low of Last 5 Trading Days
**Indicator Name:** High and Low of Last 5 Trading Days
**Purpose:**
This indicator plots the high and low levels for each of the last 5 trading days on your TradingView chart. It helps traders to visualize important price levels from the recent trading history, which can act as potential support and resistance levels.
**Features:**
1. **Daily High and Low Levels:** Plots the high and low prices for each of the last 5 trading days.
2. **Unique Colors for Each Day:** Each trading day's high and low levels are color-coded uniquely for easy identification.
3. **Solid Lines:** The high and low levels are represented by solid lines for better visibility.
4. **Day Labels:** The lines are labeled with the corresponding day and whether it is a high or low level (e.g., "MON HI", "MON LO").
5. **Dynamic Updates:** The levels and labels are updated at the beginning of each new day, ensuring that the most recent 5 days are always displayed.
**Usage:**
- **Support and Resistance:** Identify key support and resistance levels based on the previous 5 days' high and low prices.
- **Trend Analysis:** Determine the recent price trend by observing the relative positioning of the daily high and low levels.
- **Price Action:** Analyze price action around these levels to make informed trading decisions.
**Configuration:**
- The indicator does not require any user input. It automatically calculates and displays the high and low levels for the past 5 trading days.
**Visual Elements:**
- **Lines:** Solid lines in different colors (red, green, teal, purple, orange) represent the high and low levels.
- **Labels:** Text labels at the right end of each line indicate the day and whether it is a high or low level (e.g., "MON HI", "TUE LO").
This indicator provides a clear visual representation of significant price levels from the recent trading history, aiding traders in their technical analysis and decision-making process.
สคริปต์โอเพนซอร์ซ
ด้วยเจตนารมณ์หลักของ TradingView ผู้สร้างสคริปต์นี้ได้ทำให้เป็นโอเพนซอร์ส เพื่อให้เทรดเดอร์สามารถตรวจสอบและยืนยันฟังก์ชันการทำงานของมันได้ ขอชื่นชมผู้เขียน! แม้ว่าคุณจะใช้งานได้ฟรี แต่โปรดจำไว้ว่าการเผยแพร่โค้ดซ้ำจะต้องเป็นไปตาม กฎระเบียบการใช้งาน ของเรา
คำจำกัดสิทธิ์ความรับผิดชอบ
ข้อมูลและบทความไม่ได้มีวัตถุประสงค์เพื่อก่อให้เกิดกิจกรรมทางการเงิน, การลงทุน, การซื้อขาย, ข้อเสนอแนะ หรือคำแนะนำประเภทอื่น ๆ ที่ให้หรือรับรองโดย TradingView อ่านเพิ่มเติมใน ข้อกำหนดการใช้งาน