PROTECTED SOURCE SCRIPT
ICT 1st FVG + Date/News [NQTrades]
🎯 Indicator Summary: ICT 1st FVG + Date/News [NQTrades]
This indicator combines a core ICT (Inner Circle Trader) concept—the tracking of the first Fair Value Gap (FVG) of a session—with convenient on-screen information about the current date and scheduled economic news events.
🟢 Section 1: 1st FVG (Fair Value Gap) Tracker
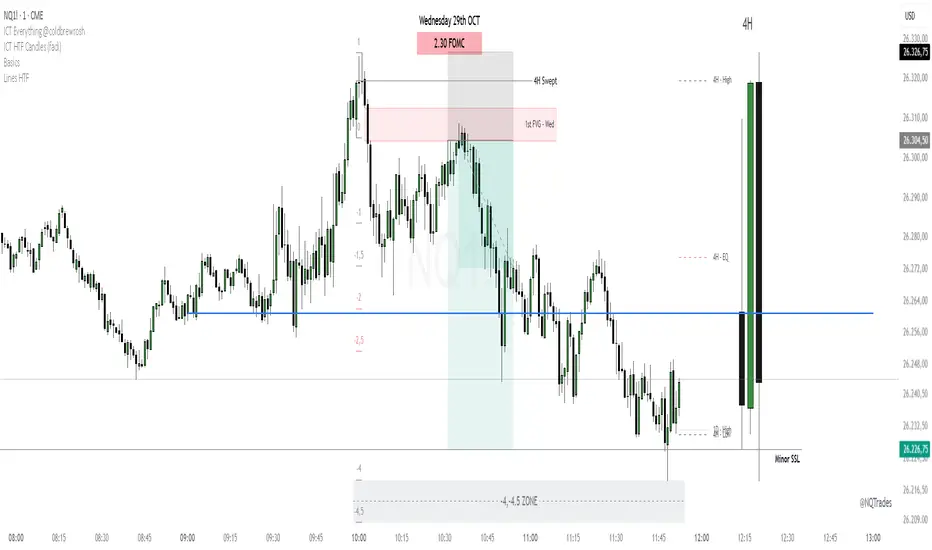
This logic is dedicated to automatically detecting and visualizing the very first Fair Value Gap that forms at the start of the trading session.
Session-Specific: The indicator only searches for an FVG within the user-defined trading session (defaulting to 09:32 - 16:00 EST for the NY session).
First Only: It plots only the first valid FVG that meets the minimum distance requirement (Min FVG Distance) and ignores all subsequent FVGs for the remainder of that session.
Visual Tracking (Modified): The FVG is drawn as a transparent box that begins at the current bar and extends forward into the chart, allowing traders to monitor its fill or reaction in real-time without cluttering the historical chart data.
Customization: Allows setting distinct colors for bullish (up) and bearish (down) FVGs.
📰 Section 2: Date & News Display
This module provides an organized, persistent display on the chart for critical time and event information.
Date & Time: Displays the current weekday, date, and month in a customizable format.
Configurable News Events: Users can set up to three high-impact news events for the day (e.g., NFP, FOMC, CPI, etc.).
Visual Alert: Each news event is displayed with its own customizable background color, text size, and text color, providing a quick visual alert for upcoming market volatility drivers.
Positioning: The entire information box (Date + News) can be anchored to any of the chart's four corners (Top/Bottom and Left/Center/Right).
This indicator combines a core ICT (Inner Circle Trader) concept—the tracking of the first Fair Value Gap (FVG) of a session—with convenient on-screen information about the current date and scheduled economic news events.
🟢 Section 1: 1st FVG (Fair Value Gap) Tracker
This logic is dedicated to automatically detecting and visualizing the very first Fair Value Gap that forms at the start of the trading session.
Session-Specific: The indicator only searches for an FVG within the user-defined trading session (defaulting to 09:32 - 16:00 EST for the NY session).
First Only: It plots only the first valid FVG that meets the minimum distance requirement (Min FVG Distance) and ignores all subsequent FVGs for the remainder of that session.
Visual Tracking (Modified): The FVG is drawn as a transparent box that begins at the current bar and extends forward into the chart, allowing traders to monitor its fill or reaction in real-time without cluttering the historical chart data.
Customization: Allows setting distinct colors for bullish (up) and bearish (down) FVGs.
📰 Section 2: Date & News Display
This module provides an organized, persistent display on the chart for critical time and event information.
Date & Time: Displays the current weekday, date, and month in a customizable format.
Configurable News Events: Users can set up to three high-impact news events for the day (e.g., NFP, FOMC, CPI, etc.).
Visual Alert: Each news event is displayed with its own customizable background color, text size, and text color, providing a quick visual alert for upcoming market volatility drivers.
Positioning: The entire information box (Date + News) can be anchored to any of the chart's four corners (Top/Bottom and Left/Center/Right).
สคริปต์ที่ได้รับการป้องกัน
สคริปต์นี้ถูกเผยแพร่เป็นแบบ closed-source อย่างไรก็ตาม คุณสามารถใช้ได้อย่างอิสระและไม่มีข้อจำกัดใดๆ – เรียนรู้เพิ่มเติมได้ที่นี่
คำจำกัดสิทธิ์ความรับผิดชอบ
ข้อมูลและบทความไม่ได้มีวัตถุประสงค์เพื่อก่อให้เกิดกิจกรรมทางการเงิน, การลงทุน, การซื้อขาย, ข้อเสนอแนะ หรือคำแนะนำประเภทอื่น ๆ ที่ให้หรือรับรองโดย TradingView อ่านเพิ่มเติมใน ข้อกำหนดการใช้งาน