OPEN-SOURCE SCRIPT
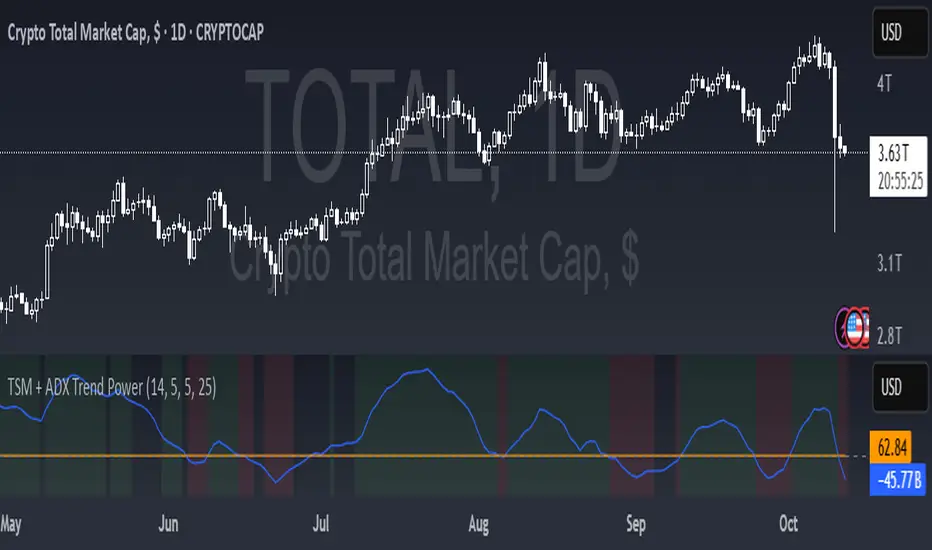
TSM + ADX Trend Power

Logic Behind This Indicator
This indicator combines two momentum/trend tools to identify strong, reliable trends in price movement:
1. TSM (Time Series Momentum)
What it does: Measures the difference between the current price and a smoothed average of past prices.
Formula: EMA(close - EMA(close, 14), 14)
Logic:
If TSM > 0 → Price is above its recent average = upward momentum
If TSM < 0 → Price is below its recent average = downward momentum
2. ADX (Average Directional Index)
What it does: Measures trend strength (not direction).
Logic:
ADX > 25 → Strong trend (either up or down)
ADX < 25 → Weak or no trend (choppy/sideways market)
Combined Logic (TSM + ADX)
The indicator only signals a trend when both conditions are met:
Condition Meaning
Uptrend TSM > 0 AND ADX > 25 → Strong upward momentum
Downtrend TSM < 0 AND ADX > 25 → Strong downward momentum
No signal ADX < 25 → Trend is too weak to trust
What It Aims to Detect
- Strong, sustained trends (not just noise or small moves)
- Filters out weak/choppy markets where momentum indicators often give false signals
- Entry/exit points:
- Green background = Strong uptrend (consider buying/holding)
- Red background = Strong downtrend (consider selling/shorting)
- No color = Weak trend (stay out or wait)
สคริปต์โอเพนซอร์ซ
ด้วยเจตนารมณ์หลักของ TradingView ผู้สร้างสคริปต์นี้ได้ทำให้เป็นโอเพนซอร์ส เพื่อให้เทรดเดอร์สามารถตรวจสอบและยืนยันฟังก์ชันการทำงานของมันได้ ขอชื่นชมผู้เขียน! แม้ว่าคุณจะใช้งานได้ฟรี แต่โปรดจำไว้ว่าการเผยแพร่โค้ดซ้ำจะต้องเป็นไปตาม กฎระเบียบการใช้งาน ของเรา
คำจำกัดสิทธิ์ความรับผิดชอบ
ข้อมูลและบทความไม่ได้มีวัตถุประสงค์เพื่อก่อให้เกิดกิจกรรมทางการเงิน, การลงทุน, การซื้อขาย, ข้อเสนอแนะ หรือคำแนะนำประเภทอื่น ๆ ที่ให้หรือรับรองโดย TradingView อ่านเพิ่มเติมใน ข้อกำหนดการใช้งาน