OPEN-SOURCE SCRIPT
0.382 Fibonacci Line of Trailing 1-year Price Range
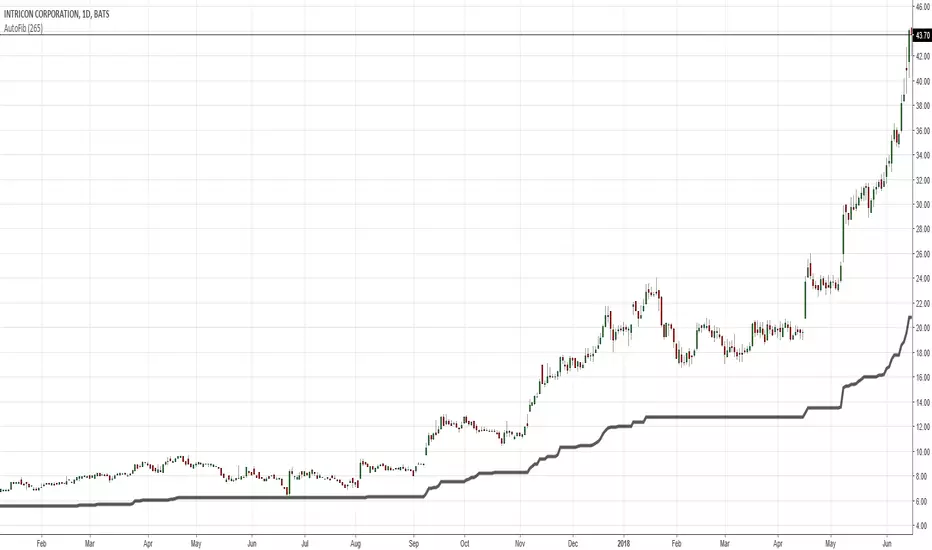
You may try adding this Line to your daily charts. It represents the 0.382 Fibonacci level of the trailing 1-year Price Range.
If price is above this line, then it is in Bullish Territory and long entries can be looked for.
According to backtesting I've done, price being above the 0.382 Fibonacci and/or the 200d sma are the 2 best determinants of
qualifying an equity to be in Bullish Territory on the daily chart.
If price is above this line, then it is in Bullish Territory and long entries can be looked for.
According to backtesting I've done, price being above the 0.382 Fibonacci and/or the 200d sma are the 2 best determinants of
qualifying an equity to be in Bullish Territory on the daily chart.
สคริปต์โอเพนซอร์ซ
ด้วยเจตนารมณ์หลักของ TradingView ผู้สร้างสคริปต์นี้ได้ทำให้เป็นโอเพนซอร์ส เพื่อให้เทรดเดอร์สามารถตรวจสอบและยืนยันฟังก์ชันการทำงานของมันได้ ขอชื่นชมผู้เขียน! แม้ว่าคุณจะใช้งานได้ฟรี แต่โปรดจำไว้ว่าการเผยแพร่โค้ดซ้ำจะต้องเป็นไปตาม กฎระเบียบการใช้งาน ของเรา
คำจำกัดสิทธิ์ความรับผิดชอบ
ข้อมูลและบทความไม่ได้มีวัตถุประสงค์เพื่อก่อให้เกิดกิจกรรมทางการเงิน, การลงทุน, การซื้อขาย, ข้อเสนอแนะ หรือคำแนะนำประเภทอื่น ๆ ที่ให้หรือรับรองโดย TradingView อ่านเพิ่มเติมใน ข้อกำหนดการใช้งาน