TRADER JUMBLO SIGNAL — Dip & Rally System
A precision-built smart trading system that detects market dips and rallies — allowing you to catch reversals right from the turning points, not halfway through the move.
🧠 How It Works (Concept Overview — no code)
The TRADER JUMBLO SIGNAL system combines trend-following and reversal-detection logic into one tool.
It analyses the last few bars (adjustable Lookback Period) to identify local extremes — the “roots” and “peaks” — and confirms entries using price structure and moving averages.
When conditions align:
-🟢 BUY Signal: Detected near the local lowest low within the lookback period during an uptrend.
-🔴 SELL Signal: Detected near the highest high during a downtrend.
-Each trade automatically sets a dynamic Stop Loss and Take Profit using the ATR (volatility-based).
-Intrabar or close-confirmed entries can be toggled for aggressive or conservative trading styles.
This system ensures you don’t chase candles — instead, it times entries at the core reversal points of the market structure.
⚙️ Key Features
-Dip & Rally Detection: Finds local highs/lows (roots and peaks) within an adjustable lookback window.
-Trend Filter: Only trades in the direction of the dominant moving-average trend.
-Intrabar Mode: Option to allow real-time entries before the candle closes.
-RSI Filter (optional): Filters out weak or overbought/oversold setups.
- ATR-based SL & TP: Automatic volatility-adjusted Stop Loss and Take Profit.
- Smart Table Display: Real-time info panel showing Entry, SL, TP, Lowest, Highest, Tolerance %, and Lookback bars.
-Customizable UI: Enable/disable labels, markers, and SL/TP lines.
Built-in Alerts:
✅ Buy (Dip) Trigger
❌ Sell (Rally) Trigger
🎯 TP Hit
🛑 SL Hit
📊 What Makes It Unique
Unlike basic crossover or RSI systems, this indicator focuses on price reaction around extremes — meaning you enter where reversals start, not after they’ve already moved.
It helps prevent:
Late entries after momentum is gone
Buying tops / selling bottoms
Random entries without market structure context
Instead, you’ll see:
Clean entries from the “roots” (local dips)
Exits or reversals from the “peaks” (local rallies)
Visual feedback for SL/TP hits — so you learn from each setup instantly.
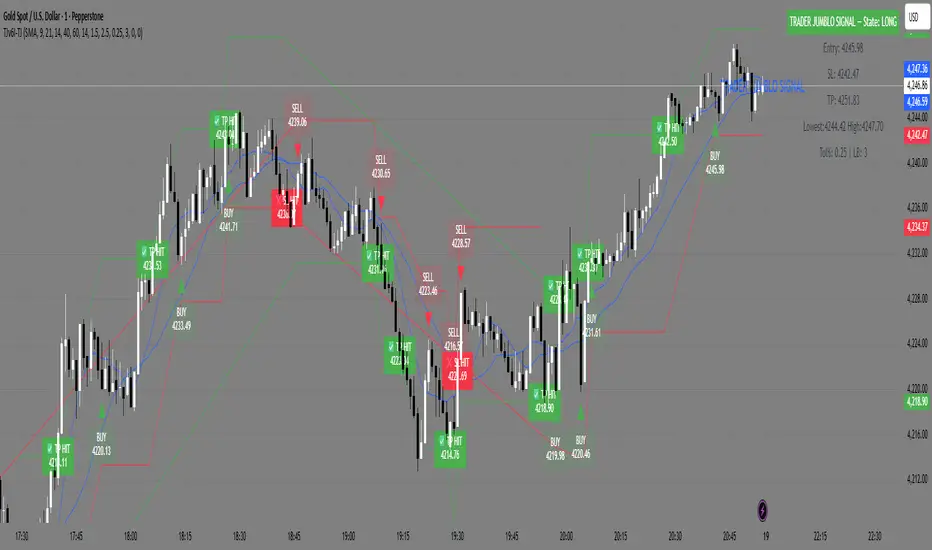
📈 Visuals
🟢 Green markers = BUY entries near local lows.
🔴 Red markers = SELL entries near local highs.
✅ “TP Hit” or ❌ “SL Hit” labels appear on price touch.
🟦 Floating table on chart shows live trade info and state (LONG / SHORT / FLAT).
สคริปต์แบบเฉพาะผู้ได้รับเชิญเท่านั้น
เฉพาะผู้ใช้งานที่ผู้เขียนอนุมัตเท่านั้นจึงจะสามารถเข้าถึงสคริปต์นี้ได้ คุณจะต้องขอและได้รับอนุญาตก่อนใช้งาน ซึ่งโดยทั่วไปจะได้รับอนุญาตหลังจากชำระเงินแล้ว สำหรับรายละเอียดเพิ่มเติม โปรดทำตามคำแนะนำของผู้เขียนด้านล่าง หรือติดต่อ TraderJumblo โดยตรง
TradingView ไม่แนะนำให้จ่ายเงินหรือใช้สคริปต์ เว้นแต่คุณจะเชื่อถือผู้เขียนและเข้าใจวิธีการทำงานของสคริปต์นั้นอย่างถ่องแท้ คุณยังสามารถหาทางเลือกแบบโอเพนซอร์สฟรีได้ใน สคริปต์ชุมชนของเรา
คำแนะนำของผู้เขียน
คำจำกัดสิทธิ์ความรับผิดชอบ
สคริปต์แบบเฉพาะผู้ได้รับเชิญเท่านั้น
เฉพาะผู้ใช้งานที่ผู้เขียนอนุมัตเท่านั้นจึงจะสามารถเข้าถึงสคริปต์นี้ได้ คุณจะต้องขอและได้รับอนุญาตก่อนใช้งาน ซึ่งโดยทั่วไปจะได้รับอนุญาตหลังจากชำระเงินแล้ว สำหรับรายละเอียดเพิ่มเติม โปรดทำตามคำแนะนำของผู้เขียนด้านล่าง หรือติดต่อ TraderJumblo โดยตรง
TradingView ไม่แนะนำให้จ่ายเงินหรือใช้สคริปต์ เว้นแต่คุณจะเชื่อถือผู้เขียนและเข้าใจวิธีการทำงานของสคริปต์นั้นอย่างถ่องแท้ คุณยังสามารถหาทางเลือกแบบโอเพนซอร์สฟรีได้ใน สคริปต์ชุมชนของเรา