OPEN-SOURCE SCRIPT
Range supply and demand
Hi all!
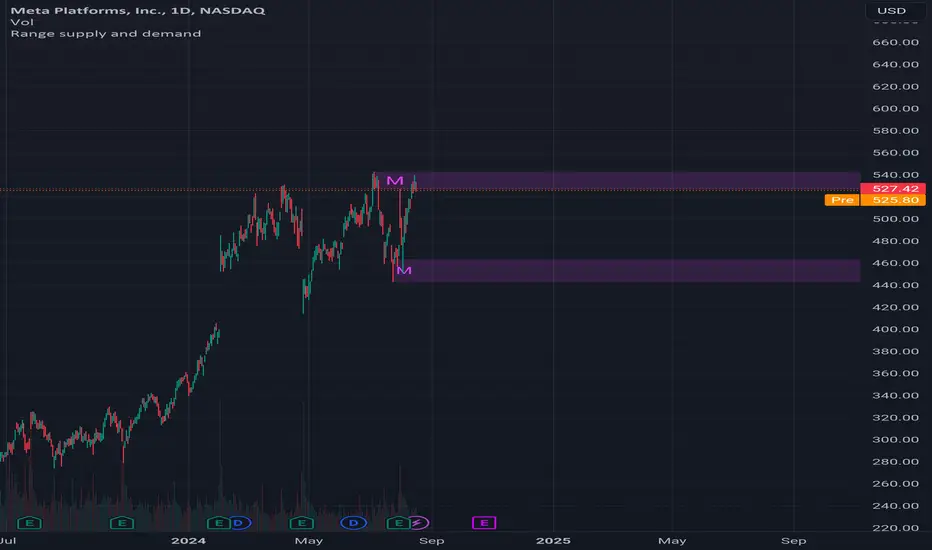
This is a very simple indicator. It plots the high timeframe (configurable via the "Timeframe" setting) high/low current timeframe bars (that has the same high/low as the higher timeframe) as supply/demand. The higher timeframe bar that's chosen is the one that's next last. As of now one high and one low zone is plotted.
The defaults are based on useful zones when on daily candles.
You can choose to display the higher timeframe within the zone via the "Show" option.
Hope this is clear enough, let me know otherwise.
Best of luck trading!
สคริปต์โอเพนซอร์ซ
ด้วยเจตนารมณ์หลักของ TradingView ผู้สร้างสคริปต์นี้ได้ทำให้เป็นโอเพนซอร์ส เพื่อให้เทรดเดอร์สามารถตรวจสอบและยืนยันฟังก์ชันการทำงานของมันได้ ขอชื่นชมผู้เขียน! แม้ว่าคุณจะใช้งานได้ฟรี แต่โปรดจำไว้ว่าการเผยแพร่โค้ดซ้ำจะต้องเป็นไปตาม กฎระเบียบการใช้งาน ของเรา
คำจำกัดสิทธิ์ความรับผิดชอบ
ข้อมูลและบทความไม่ได้มีวัตถุประสงค์เพื่อก่อให้เกิดกิจกรรมทางการเงิน, การลงทุน, การซื้อขาย, ข้อเสนอแนะ หรือคำแนะนำประเภทอื่น ๆ ที่ให้หรือรับรองโดย TradingView อ่านเพิ่มเติมใน ข้อกำหนดการใช้งาน