Recap ทองคำ 10 พฤศจิกายน พ.ศ. 2568สวัสดีครับทุกคน!
ผมโค้ชเต้ย Supply & Demand ครับ
เช้าวันจันทร์ที่ 10 พฤศจิกายน 2568
(ตามเวลาในกราฟ)
เรามาวิเคราะห์แผนเทรดทองคำ (XAUUSD)
ใน Timeframe H1 ด้วยหลักการ Supply & Demand กันครับ
มาดูกันว่า Smart Money เขาวางแผนจะเล่นกันทางไหน
📌 อัพเดท 10 พฤศจิกายน พ.ศ. 2568 (H1)
📊 ราคาทองคำปัจจุบัน (Last Close)
* ~ 4007.24
📈 โครงสร้าง Supply & Demand
* ใน Timeframe H1 ราคากำลังเคลื่อนที่อยู่ในกรอบ Ascending Channel (ช่องราคาขาขึ้น) อย่างชัดเจนครับ
* ปัจจุบัน ราคาแกว่งตัวอยู่บริเวณกลาง-บน ของช่องสัญญาณนี้ และกำลังเข้าใกล้โซน Supply (แนวต้าน) ด้านบน
* ภาพรวมระยะสั้นยังเป็นการยก Low ยก High แต่ต้องระมัดระวังแรงขายเมื่อราคาเข้าใกล้โซนต้านสำคัญครับ
🛡️ เเนวรับ (Demand Zone)
* 3997.61 (แนว Pivot / กลางกรอบ)
* 3985.48 (โซน Demand ย่อย / กรอบ Channel ล่าง)
* 3974.97 (โซน Demand หลัก)
⚔️ เเนวต้าน (Supply Zone)
* 4017.93 (โซน Supply ย่อย / กรอบ Channel บน)
* 4026.49 (โซน Supply หลักชุดแรก)
* 4075.23 (โซน Supply H1/H4 ด้านบน)
🎯 โซนเข้าเทรด (Key Zones)
* โซน Sell (Supply): มองหาโอกาสที่โซน 4017.93 - 4026.49 โซนนี้มีการปฏิเสธราคาที่รุนแรงหลายครั้ง (ไส้เทียนยาว) แสดงถึงแรงขายของรายใหญ่ที่รออยู่
* โซน Buy (Demand): มองหาโอกาสที่โซน 3985.48 - 3974.97 หรือบริเวณแนวรับของกรอบ Channel ล่าง
💡 แผนการเทรด (Trading Plan)
* แผน Sell (รอตบลง):
* รอให้ราคาขึ้นไปทดสอบโซน Supply 4017.93 - 4026.49
* มองหาสัญญาณ Confirmation (เช่น Pin Bar, Engulfing) เพื่อเข้า Sell
* SL: 4030 (เหนือโซน)
* TP: 3997.61 / 3985.48
* แผน Buy (รอย่อซื้อ):
* รอให้ราคาย่อตัวลงมาทดสอบโซน Demand 3985.48 หรือแนวรับกรอบ Channel ล่าง
* มองหาสัญญาณกลับตัว (Confirmation) เพื่อเข้า Buy
* SL: 3970 (ใต้โซน)
* TP: 4007 / 4017.93
* แผน Breakout (Follow Trend):
* หากราคาสามารถ ทะลุ โซน Supply 4026.49 ขึ้นไปยืนได้อย่างแข็งแกร่ง ให้รอราคาย่อกลับมาทดสอบโซนนี้ (ที่เปลี่ยนเป็นแนวรับ) แล้วค่อยพิจารณา Buy ตามขึ้นไป โดยมีเป้าหมายที่ 4075.23
📰 ข่าวสารประกอบการเทรด
* วันนี้ (จันทร์ที่ 10 พ.ย.): ตลาดเพิ่งเปิดทำการ ยังไม่มีข่าว "กล่องแดง" ที่ส่งผลกระทบโดยตรงรุนแรง
* แนวโน้มข่าว: ตลาดจะรอจับตาท่าทีของธนาคารกลาง (FED) และตัวเลขเงินเฟ้อในสัปดาห์ หากไม่มีข่าวใดๆ กราฟมักจะเคลื่อนไหวตามเทคนิค (Supply & Demand) เป็นหลัก
* ผลกระทบ: วันนี้คาดว่า ข่าวมีผลกระทบต่ำถึงปานกลาง ให้เน้นการเทรดตามโซนที่วางแผนไว้ครับ
⚠️ คำเตือนความเสี่ยง
การเทรด Forex และทองคำมีความเสี่ยงสูง อาจสูญเสียเงินลงทุนทั้งหมด ควรเทรดด้วยความระมัดระวัง (Risk Management) และใช้เงินทุนที่ยอมรับการสูญเสียได้เท่านั้น
‼️ คำจำกัดความรับผิดชอบของกลุ่ม CT Trader
บทวิเคราะห์นี้จัดทำขึ้นเพื่อวัตถุประสงค์ในการให้ความรู้และแลกเปลี่ยนมุมมองเท่านั้น ไม่ใช่การชี้ชวนหรือให้คำแนะนำในการลงทุน ผู้เทรดควรตัดสินใจด้วยตนเอง และรับผิดชอบต่อผลกำไรหรือขาดทุนที่เกิดขึ้น
ไอเดียชุมชน

Gold Trading Plan 10/11/2025Gold Trading Plan — 10/11/2025 👇👇
🔹 Trend
D1 Uptrend / H4 Downtrend / H1 Uptrend
🔹 Overview
Gold on the H1 timeframe remains in an uptrend, suggesting the possibility of a continued move upward toward 4065. Therefore, buying on a pullback is preferable. However, for this bullish scenario to remain valid, the price should not break below 4012 (SL).
🔹 Summary
Buy Plan (wait around 4032–4025 approximately)
SL: 4012
TP: 4065
RR: 1.64
🔹 Disclaimer
This plan represents only the author’s personal market view and is not investment advice. Please exercise judgment and apply appropriate risk management.

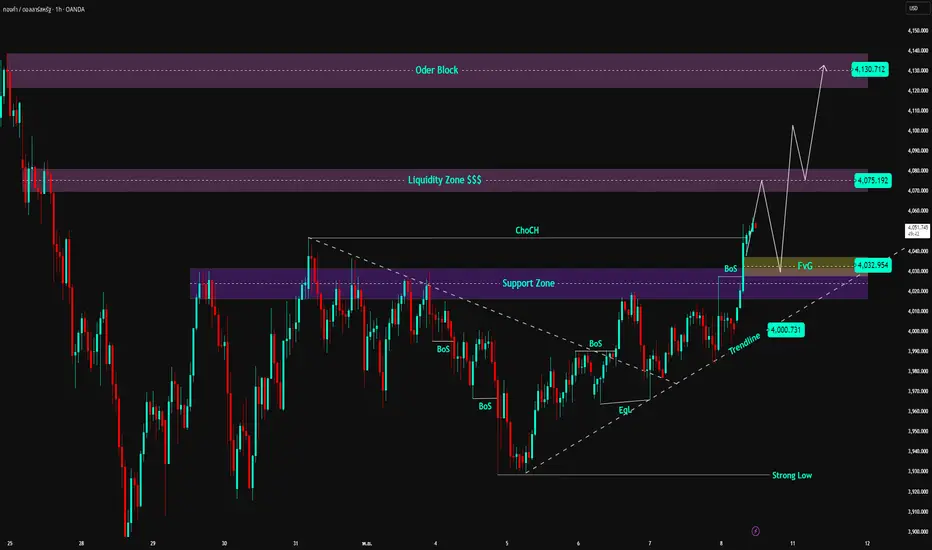
ทองคำทดสอบ FVG เตรียมพร้อมคลื่นขาขึ้นใหม่ เป้าหมาย 4,120 USD📊 โครงสร้างตลาด
ทองคำได้ ทำลายโครงสร้างขาลง (BoS + ChoCH) อย่างเป็นทางการเมื่อทะลุโซน 4,025 USD ยืนยันการเปลี่ยนแปลงที่ชัดเจนในแรงขับเคลื่อนของตลาด
หลังจากชุด BoS ต่อเนื่อง และการทำลายเส้นแนวโน้มขาลง ราคาได้เข้าสู่ช่วง ทดสอบสมดุล (FVG 4,030 – 4,040 USD)
ตราบใดที่ราคายังคงอยู่เหนือโซนสนับสนุน 4,020 USD โครงสร้างขาขึ้นยังคงได้รับการปกป้องและคาดว่าจะมุ่งสู่ โซนสภาพคล่อง 4,070 – 4,090 USD และต่อไปยัง Order Block 4,118 – 4,125 USD
💎 โซนเทคนิคสำคัญ
• โซนทดสอบ FVG: 4,030 – 4,040 USD
• สนับสนุนเส้นแนวโน้ม: รอบๆ 4,000 USD
• โซนสภาพคล่อง: 4,070 – 4,090 USD
• เป้าหมายสุดท้าย (OB): 4,118 – 4,125 USD
🎯 แผนการซื้อขาย
1️⃣ BUY Setup #1 – ทดสอบ FVG (หลัก)
หากราคาปรับตัวลงไปยังโซน FVG 4,030 – 4,040 USD และสร้างสัญญาณยืนยันขาขึ้น (แท่งเทียนขาขึ้น / ไส้เทียนปฏิเสธ):
• Entry: 4,033 – 4,038
• SL: 4,020
• TP1: 4,070
• TP2: 4,090
• TP3: 4,120
→ เข้าซื้อที่โซน “discount” หลังจากตลาดดูดซับสภาพคล่อง
2️⃣ BUY Setup #2 – ป้องกัน (ทดสอบลึกเส้นแนวโน้ม)
หากราคาปัดเบาๆ ไปยังโซน OB เล็กๆ รอบเส้นแนวโน้ม:
• Entry: 3,998 – 4,004
• SL: 3,985
• TP1: 4,070
• TP2: 4,120
→ โครงสร้างยังคงเดิม การเข้าในนี้มี RR สูง เหมาะสำหรับ swing mid-term
⚠️ การยกเลิก:
• หากราคาปิดแท่ง H1 ต่ำกว่า 3,985 USD → แนวโน้มขาขึ้นระยะสั้นถูกทำลาย
🧠 มุมมองของ Vincent
ฝั่งซื้อกำลังควบคุมโครงสร้าง H1 อย่างเต็มที่หลังจากทำลายเส้นแนวโน้มขาลงที่ยาวนานเกือบ 2 สัปดาห์
ราคามีโอกาสสูงที่จะเสร็จสิ้นการทดสอบ FVG – เส้นแนวโน้ม – ทดสอบการทะลุก่อนที่จะขยายไปยังจุดสูงสุดของสภาพคล่อง 4,120 USD
นี่คือช่วง “buy-the-dip” เชิงกลยุทธ์สำหรับสัปดาห์นี้
“Smart money buys the discount while everyone waits for confirmation.” ⚜️🟡
⏰ กรอบเวลา: 1H
📅 อัปเดต: 10/11/2025
✍️ วิเคราะห์โดย: Captain Vincent
ราคาทองคำทะลุกรอบ: คาดการณ์สัปดาห์หน้า!วันศุกร์ปิดที่ 4,000 จุด ยืนเหนือแนวรับ FVG; Trend Finder ดึงกรอบขึ้นจาก 3,929 จุด โดยโซน “มองเห็นได้ชัดเจน” ส่งสัญญาณว่ามีโอกาสทะลุกรอบใกล้ 4,050 จุด
มีโอกาสปรับตัวขึ้นหากราคาเปิดวันจันทร์ทะลุ 4,020 จุด ตั้งเป้าแนวต้านที่ 4,050 จุด มีโอกาสปรับตัวขึ้นจากดอลลาร์สหรัฐที่อ่อนค่าและเฟดที่มีแนวโน้มผ่อนคลาย
จับตาเปิดตลาดสหรัฐฯ ทดสอบปริมาณการซื้อขายที่เพิ่มขึ้น คาดการณ์แนวโน้มขาขึ้น เนื่องจากตลาดตอบรับกระแสเงินทุนปลอดภัยจากสถานการณ์ทางการเมือง
ราคาทองคำทรงตัวในช่วงสุดสัปดาห์ พร้อมสัญญาณที่ชัดเจน—วันจันทร์จะทะลุ 4,050 จุดหรือไม่? แบ่งปันการคาดการณ์แนวโน้มขาขึ้นของคุณด้านล่าง ติดตาม!

วิเคราะห์คลื่น Elliott – XAUUSD (สัปดาห์ที่ 2 พฤศจิกายน 2025)
🔹 โมเมนตัม
กรอบ W1:
โมเมนตัมรายสัปดาห์กำลังเข้าใกล้โซน Oversold ซึ่งบ่งบอกถึงความเป็นไปได้สูงที่ราคาจะกลับตัวขึ้นภายใน 1–2 สัปดาห์ข้างหน้า หากได้รับการยืนยัน แนวโน้มขาขึ้นระยะกลางถึงยาวใหม่อาจเริ่มต้นได้
กรอบ D1:
โมเมนตัมรายวันกำลังเข้าสู่โซน Overbought ภายใน 1–2 วันแรกของสัปดาห์ (เริ่มวันจันทร์) มีโอกาสสูงที่ราคาจะกลับตัวลง หากเกิดขึ้น ราคาน่าจะปรับฐานระยะสั้นเพื่อลดโมเมนตัม D1 กลับสู่โซน Oversold เมื่อ D1 และ W1 กลับตัวขึ้นพร้อมกันจากโซน Oversold จะเป็นสัญญาณแข็งแกร่งของการเริ่มต้นแนวโน้มขาขึ้นใหม่
กรอบ H4:
โมเมนตัม H4 ขณะนี้กำลังอ่อนตัว จึงคาดว่าจะมีแรงขายในช่วงตลาดเอเชีย อย่างไรก็ตาม เนื่องจากราคากำลังถูกบีบตัวใน เขตสภาพคล่องหลัก (POC) ที่ทำเครื่องหมายไว้ในกราฟ ทิศทางถัดไปจึงยังไม่ชัดเจน ควรรอให้ราคาทะลุออกจากบริเวณนี้อย่างชัดเจนก่อนยืนยันแนวโน้มถัดไป
________________________________________
🔹 โครงสร้างคลื่น
กรอบ W1:
โครงสร้างหลักยังอยู่ใน คลื่น (4) สีเหลือง โดยที่โมเมนตัม W1 เข้าใกล้โซน Oversold จึงมีแนวโน้มสูงว่าคลื่น (4) จะจบลงภายใน 1–2 สัปดาห์ข้างหน้า และเปิดทางให้ คลื่น (5) เริ่มขาขึ้นต่อ
กรอบ D1:
ราคากำลังอยู่ในช่วงปรับฐานของคลื่น (4) สีเหลือง โดยอยู่ในรูปแบบ W–X–Y สีม่วง
• คลื่น W (สีม่วง) จบแล้ว
• ตอนนี้ราคาอาจกำลังสร้าง คลื่น X และเมื่อ X จบ ราคามีแนวโน้มปรับลงต่อเพื่อสร้าง คลื่น Y ให้สมบูรณ์
คลื่น W แตะระดับ Fibonacci 0.382 ของคลื่น (3) แล้ว ซึ่งเป็นเป้าหมายขั้นต่ำตามทฤษฎี Elliott เมื่อราคาแตะเป้าหมายเร็วเกินไป โครงสร้างมักจะพัฒนาในลักษณะ Sideway เพื่อให้สมบูรณ์ในด้านเวลา
ความเป็นไปได้ที่ควรจับตา:
• คลื่น W เสร็จสมบูรณ์แล้ว
• คลื่น X อาจเสร็จในรูปแบบ 3 คลื่น a–b–c (สีดำ)
• คลื่น Y อาจกำลังพัฒนาเป็น รูปสามเหลี่ยม a–b–c–d–e
สถานการณ์นี้จะได้รับการยืนยันมากขึ้น หากโมเมนตัม D1 เข้าสู่โซน Oversold พร้อมกับโมเมนตัม W1 กลับตัวขึ้น ในขณะที่ราคายังคงอยู่ เหนือ 3897
กรอบ H4:
เนื่องจากโมเมนตัม D1 มีแนวโน้มกลับตัวลงในไม่ช้า จึงยังคงให้ความสำคัญกับโครงสร้าง W–X–Y ตามกราฟ ราคากำลังเคลื่อนไหวบริเวณ POC (เส้นสีเขียว) ซึ่งเป็นพื้นที่สภาพคล่องสูงสุด ราคากำลังเข้าใกล้ POC จากด้านล่าง ขณะที่ D1 และ H4 กำลังจะกลับตัวลง นี่เป็นสัญญาณของการปรับฐานลงเพื่อจบคลื่น y
โซน 4038 และ 4145 เป็นแนวต้านสำคัญ ซึ่งอาจเป็นจุดสิ้นสุดของคลื่น X (สีม่วง) ในตอนนี้ราคากำลังถูกบีบตัวอยู่ใน รูปแบบสามเหลี่ยม และควรรอการทะลุ (Breakout) ขึ้นหรือลงเพื่อยืนยันทิศทางต่อไป
________________________________________
🔹 แผนการเทรด
ในระยะสั้น ควรหลีกเลี่ยงการเปิดออเดอร์ใหม่ขณะราคายังอยู่ในช่วงบีบตัว ติดตามการเปิดตลาดวันจันทร์เพื่อดูทิศทางการ Breakout อย่างชัดเจน จากนั้นจึงค่อยวางแผนเทรดอย่างแม่นยำและปลอดภัยยิ่งขึ้น

BTCUSD Daily Analysis 9/11/2025 by AlphaQuantXBINANCE:BTCUSDT ข้อมูลข่าวสาร:
Donald Trump ประกาศกร้าว “จะไม่ยอมให้จีนขึ้นเป็นเบอร์หนึ่งโลกด้านคริปโต!”
Donald Trump ประธานาธิบดีสหรัฐฯ และผู้นำแนวทางสนับสนุนคริปโต ออกมาประกาศอย่างชัดเจนว่า “ผมจะไม่ยอมให้จีนขึ้นเป็นอันดับหนึ่งในวงการคริปโต” สะท้อนจุดยืนของเขาในการผลักดันให้สหรัฐฯ กลับมาเป็นผู้นำด้านเทคโนโลยีบล็อกเชนและสินทรัพย์ดิจิทัลของโลก
หลายประเทศเริ่มหันมาให้ความสำคัญกับ Bitcoin และการพัฒนาโครงสร้างพื้นฐานด้านคริปโตมากขึ้น โดยเฉพาะจีน ที่แม้จะเคยปราบปรามการขุดและเทรดคริปโต แต่กลับเร่งพัฒนาเทคโนโลยี Blockchain และ CBDC อย่างหยวนดิจิทัลแบบจริงจัง
นโยบายคริปโตของสหรัฐฯได้เปลี่ยนทิศอย่างสิ้นเชิง จากความระแวดระวังในยุคก่อน สู่การสนับสนุน Bitcoin และสินทรัพย์ดิจิทัลอย่างเป็นทางการ เพื่อแข่งขันกับจีนโดยตรง
คำพูดของ Trump สะท้อนชัดว่า “สงครามคริปโต” ระหว่างมหาอำนาจโลกได้เริ่มต้นขึ้นแล้วและสหรัฐฯ จะไม่ยอมให้จีนขึ้นนำในสนามแห่งอนาคตนี้ได้
BUY : 1027622
TP : 105373
SL : 101284
เหตุผลในการเข้าเทรด:
จากกราฟแท่งเทียนในกรอบ TF 4
ราคายังคงวิ่งในกรอบไซด์เวย์กว้าง โดยราคาสวิงขึ้นลงตามรอบระยะสั้นๆ โดยรอบขาขึ้นเริ่มมีลุ้นมากกว่า จากการยืนเหนือเส้น EMA20-50 เป็นไปได้ที่ราคาจะดีดตัวสวิงนกรอบขึ้นไปหากรอบบนของรอบสวิง จึงทำการเข้า BUY โดยเน้นรูปแบบการทำกำไรแบบ scalping ในระยะสั้นๆตามกรอบเส้นเทรนไลน์
จุดเข้า - จุดออก เป้าหมายการทำกำไร
ใช้สัญญาณการกลับตัวขึ้นจากกรอบไซด์เวย์ และเป็นไปได้ที่จะสวิงในกรอบกว้างเพื่อเป็นการพักตัวเพื่อทาง โดยยังมีลุ้นในขาขึ้นระยะสั้นอยู่ ยังคงเน้นเก็บกำไรสั้นๆ
RSI เป็นกลาง ยังคงเน้นเก็บกำไรระยะสั้นแบบ Scalping รายวัน กำหนดจุดกำไร และตั้ง SL ระยะห่างไม่ไกลมากเพื่อป้องกันความเสี่ยง เน้นจบปิดกำไรรายวัน และอาจปิดเร็วขึ้น หากกำไรเป็นที่พอรับได้ โดยมีตั้งกำไร TP และตั้ง SL ไม่ไกลจากแนวรับแนวต้านเดิม ทั้งใน TF1H และ 4H และจะทำการล๊อคกำไรจาก TSL ด้วยระดับหนึ่ง
ประสบการณ์: เน้นการถืออออเดอร์โดยปิดจบรายวัน และเน้นเก็บกำไรแบบเป็นรอบสวิงเทรนไซด์เวย์ เพื่อเป็นการเพิ่มกระแสเงินสด แคชโฟร์ ในพอร์ต อาจมีการแบ่งปิดกำไรจากออเดอร์ที่กำไรในระดับหนึ่งแล้ว อาจมีการตั้ง TSL เพื่อเป็นการล๊อคกำไรได้ในอีกทางหนึ่งด้วย
เพื่อนๆคิดว่าตลาดตอนนี้ป็นขาขึ้น (Bullish)หรือขาลง (Bearish)ครับ คอมเม้นท์ด้านล่างไว้ได้เลย !!!
“หากบทวิเคราะห์นี้ดี…มีประโยชน์กับเพื่อนๆนักเทรดทุกท่าน
กรุณากดติดตามและสนับสนุนพวกเราด้วยนะครับ…ขอบคุณครับผม”

SET50 Insights: ส่องทิศทาง S50Z25 ผ่านเลนส์ Data&AI | 10 พ.ย. 68🔥🔥สหรัฐเจรจา Shutdown คืบหน้า ! หุ้นต่างประเทศบวก แต่ไทย... ?
📌 Data Checkpoints - เหตุการณ์สำคัญวันก่อน
🔴 ราคาเปิดโดดหลุดเทรนขาขึ้นระยะสั้น มีรีบาวด์ระหว่างวันแต่มาพร้อมแรงขายปริศนา
🔴 ต่างชาติตัวการ กลับมาขายติด 2 วันกว่า 3,500 ล้าน
🟢 ดาวโจนพลิกนรกรีบาวด์จาก -400 จุดกลับมาปิดบวก
🟢 ส่งแรงบวกต่อเช้านี้ เอเชียโทนเขียวแต่ไม่เข้ม
⸻⸻
📉 Outlook&Tactical Plan - ภาพรวมแนวโน้มวันนี้
🔹Trend : ราคากลับมาเข้ากรอบ SidewayDown จากแรงขายวันศุกร์ เช้านี้มีแนวโน้มเปิดบวกตัดสินกันที่ 848-850 ต้องปิดยืนให้อยู่ในวันนี้เพื่อส่งภาพบวกต่อทั้งสัปดาห์
🟢 Bullish Plan :
เทรดฝั่ง Long : ต้องยืนเหนือ 848 ได้อย่างมั่นคง เพื่อยืนยันแรงซื้อกลับ
แนวรับสำคัญ: 845 / 842 / 839
แนวต้าน: 851 / 855 / 861
🔴 Bearish Plan :
หากราคาไม่ผ่านแนวต้านและเกิดแท่งกลับตัว มีโอกาสย่อต่อทดสอบ 845 / 841 / 837
โซนแนวต้านสำคัญ: 851–855 (Trend Line + EMA บน TF15–TF60)
🟡 Sideway Plan :
คาดแกว่งในกรอบ 841–851
Volume ลดลง และ Momentum ไม่มีทิศทางเด่น
⸻⸻
🎯 Key levels - โซนราคาสำคัญ
🛡️แนวรับ (Support) : 840-841
3 จุดร่วม : EMA200 (TF60),EMA25 (TFDay),Fibo2 61.8
⚔️แนวต้าน (Resistant) : 847-848
13 จุดร่วม :EMA10 (TF15),EMA10 (TF60),EMA25 (TF15),EMA5 (TF60),EMA10 (TFDay),EMA200 (TF15),EMA25 (TF60),EMA5 (TF15),EMA5 (TFDay),EMA75 (TF15),EMA75 (TF60),Mode สะสม week ก่อน,Mode สะสมเมื่อวาน
⸻⸻
⚡ AI Probability & Forecast – คาดการณ์เหตุการณ์ที่น่าสนใจ
🔹50% → Bearish Pullback (พักฐานต่อ)
แรงซื้อเริ่มอ่อนหลังชนแนวต้าน 851–855
RSI และ MACD แสดงสัญญาณพักตัว มีโอกาสย่อลงทดสอบแนวรับ 841–839
🔹35% → Sideway Neutral (พักในกรอบกลาง)
ราคาอาจเคลื่อนไหวในกรอบ 841–851 เพื่อสะสมพลัง
หากไม่มีปัจจัยใหม่เข้ามาหนุน
🔹15% → Bullish Rebound (รีบาวด์สั้น)
มีโอกาสเกิดรีบาวด์ทางเทคนิคจากแนวรับ 841–839
แต่หากไม่สามารถผ่าน 851 ได้ จะกลับเข้าสู่โหมดพักตัว
👀 สรุป : แม้สถานการณ์ต่างประเทศรีบาวด์ แต่ไทยอาจได้รับผลบวกระยะสั้นช่วงเปิด หากภาพถ้าเล่นบริเวณ 850 แล้วไม่ผ่านจะเป็นการคอนเฟิร์มผ่านแนวต้านและมีแรงขายรอ โดยเฉพาะต่างชาติที่เริ่มกลับมาต่อเนื่องและพร้อมShort
#TFEX #S50Z25 #SET #หุ้น #หุ้นไทย #ตลาดหุ้น #SET50 #derivatives

มุมมองทองคำ 10 พ.ย. 2568🔴 Super Free Gold Forex 🔴
มุมมองทองคำ 10 พ.ย. 2568
💥 หากมีข้อสงสัย หรือ คำถามเพิ่มเติม ส่งคอมเม้นไว้ หรือ กล่องข้อความได้นะครับ
🔥 อาจจะไม่ได้อัพเดทใน TradingView ทุกวันนะครับ รบกวนฝากกดติดตามไว้ด้วยนะครับ

XAUUSD 10/11/25 ลุ้นขึ้น test 4046 ถ้าไม่หลุด 3976 3965 3928.6ทองอยู่ในช่วง ปรับฐานระยะ D
กรอบเลือกทาง 3886-4046
เริ่มมีลุ้นปรับฐานจบขึ้น test 4046 ยืนได้
- 240 os HL ถ้าไม่หลุด 3928.6
- 60 พาขึ้นได้ถ้าไม่หลุด 3965
- 15 sw up ไม่หลุด 3976
- ถ้าไล่หลุดเนว 15 60 240 ลงมา การ sw test 3886 ได้
***การเปิด order ควรมีแผน รับเสี่ยงได้คำนวณ RR คุ้ม วาง stop loss ทุกครั้ง
เพราะวินัย คือสิ่งสำคัญในการเป็นมืออาชีพ***
บทความนี้ เป็นการบันทึกแนวคิดจากกราฟ
โดยผู้เขียนหวังเพื่อเป็นประสบการณ์ศึกษากราฟของตนเอง และเพิ่มแนวคิดให้กับเพื่อนผู้อ่าน
มาร่วมปิดความผิดพลาดในการดูกราฟให้น้อยลง เพื่อการเทรดที่ดีขึ้น
สร้างสังคมการอ่านกราฟไปด้วยกัน แลกเปลี่ยนแนวคิดได้ที่คอมเม้นท์ ไม่มีผิดถูก

ตลาดสร้างการกลับตัวอย่างไร — “Structure Shift”!«ทุกการกลับตัวเริ่มต้นจากการชะลอตัว — ไม่ใช่จากสัญญาณเดียว.»
📉 เทรดเดอร์ทุกคนอยากจับจุดสูงสุดและต่ำสุดของราคา แต่ตลาดไม่เคยกลับตัวเพียงแค่ด้วยแท่งเทียนเดียว
การกลับตัวจริง (reversal) ถูกสร้างผ่านโครงสร้าง (structure) ของตลาด:
แนวโน้มเก่าเริ่มสูญเสียแรง → ปรากฏสัญญาณ CHoCH (Change of Character)
จากนั้นมีการ retest โซนโครงสร้างใหม่ (BOS – Break of Structure) → ยืนยันการเปลี่ยนทิศทางแนวโน้ม
เทรดเดอร์รายย่อยส่วนใหญ่ล้มเหลว เพราะสับสนระหว่าง pullback กับ reversal
บนกราฟ การย่อตัวเล็กน้อยอาจดูเหมือนการกลับตัวของเทรนด์ — แต่จริงๆ แล้วนั่นคือการเก็บ liquidity ก่อนการเคลื่อนที่ต่อเนื่อง
📊 กระบวนการกลับตัวแบบทั่วไป:
ราคาลดลง พร้อมสร้างโครงสร้าง Lower Highs – Lower Lows
จู่ๆ ปรากฏ CHoCH (ราคาสูงกว่าจุดสูงก่อนหน้า)
ตามด้วย retest แนวรับใหม่ และจากนั้นเกิดแรง impulse ขึ้นอย่างชัดเจน
รูปแบบนี้ไม่ใช่เรื่องบังเอิญ — มันสะท้อน “การเปลี่ยนการควบคุม” จากฝั่งผู้ขายไปยังผู้ซื้อ
หากคุณเปิดออเดอร์เพียงเพราะเห็นแท่ง reversal เดียว — นั่นคือการตัดสินใจด้วยอารมณ์ ไม่ใช่ตามโครงสร้างตลาด
🧠 เมื่อรู้สึกว่าตลาดอาจกลับตัว ให้ถามตัวเองว่า:
“Has the structure shifted yet?”
ถ้ายังไม่มีสัญญาณ CHoCH หรือ BOS ที่ชัดเจน — ให้อยู่ข้างสนามไว้ก่อน
เทรดเดอร์มืออาชีพไม่ได้พยายามจับจุดสูงสุดหรือต่ำสุด — พวกเขารอให้โครงสร้างยืนยันก่อน
จำไว้: “Structure first, setup later.”

ฝึกวิเคราะห์เพื่อหาจุดเข้าซื้อให้แม่นยำยิ่งๆขึ้นไปกำหนดแผนรูปแบบตามเงื่อนไขข้อบังคับของตัวเองแล้วรอจนเข้าเงื่อนไขในการเข้าออเดอร์และ money management

ฝึกวิเคราะห์เพื่อหาจุดเข้าซื้อให้แม่นยำยิ่งๆขึ้นไปมันมีรูปแบบ3รูปแบบอย่าคิดว่ามันจะขึ้นเลย
อย่าคิดว่ามันจะลงเลย มันอาจจะSWก็ได้
เข้าBUYก็โดน เข้าSELLก็โดน ฉะนั้นหารูปแบบ
การเทรดแล้วจัดเลยครับกำไรก็ปิดจำรูปแบบที่
ตัวเองกำไรจดบันทึกการเทรดครับ เทรดSWใช้รูปแบบไหน
เทรดตามเทรนใช้รูปแบบไหน ตั้งSLแบบไหน
เทรดสวนเทรนใช้รูปแบบไหน จัดเลยครับ
กำหนดแผนรูปแบบตามเงื่อนไขข้อบังคับของตัวเองแล้วรอจนเข้าเงื่อนไขในการเข้าออเดอร์และ money management

ฝึกวิเคราะห์เพื่อหาจุดเข้าซื้อให้แม่นยำยิ่งๆขึ้นไปกำหนดแผนรูปแบบตามเงื่อนไขข้อบังคับของตัวเองแล้วรอจนเข้าเงื่อนไขในการเข้าออเดอร์และ money management

XAUUSD Daily Analysis 10/11/2025 by AlphaQuantXTrading note: XAUUSD / GOLD
ตลาดหุ้นเอเชียปิดภาคเช้าปรับตัวขึ้นในวันนี้ (10 พ.ย.) โดยได้แรงหนุนจากการที่ร่างกฎหมายงบประมาณชั่วคราวของสหรัฐฯ มีความคืบหน้าครั้งสำคัญ และอาจทำให้หน่วยงานของรัฐบาลกลางกลับมาเปิดทำการอีกครั้ง หลังจากกลุ่มสมาชิกพรรคเดโมแครตสายกลางได้ลงคะแนนสนับสนุนข้อตกลงเพื่อยุติการปิดหน่วยงานของรัฐบาล หรือชัตดาวน์ ที่ยืดเยื้อเป็นเวลานานที่สุดในประวัติศาสตร์ของสหรัฐฯ
ด้านธนาคารกลางญี่ปุ่น (BOJ) เปิดเผยรายงานสรุปความคิดเห็น (Summary of Opinions) ของกรรมการ BOJ ในวันนี้ โดยระบุว่า ในการประชุมเมื่อวันที่ 29-30 ต.ค. ที่ผ่านมา กรรมการ BOJ ได้หารือกันว่า การปรับขึ้นอัตราดอกเบี้ยครั้งต่อไปน่าจะเกิดขึ้นอย่างเร็วที่สุดในการประชุมเดือนธ.ค. ซึ่งสอดคล้องกับการคาดการณ์ของตลาด
BUY : 4068
TP : 4135
SL : 4015
เหตุผลในการเข้าเทรด:
Trendline
จากกราฟแท่งเทียนในกรอบTF H1-H4
ราคาทะลุกรอบสามเหลี่ยมและกลับตัวขึ้น โดยการยืนเหนือเส้น EMAทั้งสามเส้นในกรอบ H4 ทำให้มีลุ้นในการขึ้นต่อ และเป็นไปได้ที่ราคาจะขึ้นไปทดสอบแนวต้านเก่าอีกครั้ง จากกรอบไซด์เวย์กว้าง จึงทำการเข้า BUY โดยเน้นรูปแบบการทำกำไรแบบ scalping ในระยะสั้นๆตามกรอบเส้นเทรนไลน์
จุดเข้า - จุดออก เป้าหมายการทำกำไร
ใช้สัญญาณแท่งเทียนการทะลุออกนอกรอบสามเหลี่ยม โดยการยืนเหนือเส้น EMA ทั้งสามเส้น โดยราคาเริ่มมีลุ้นในขาขึ้นต่อ ในกรอบ H4 โดยตั้งเป้าหมายกำไร 1000 จุดขึ้นไป และตั้ง TSL เมื่อกำไรเริ่มบวกแล้ว 500 จุด
RSI : เป็นขาขึ้น เน้นจบปิดกำไรรายวัน และอาจปิดเร็วขึ้น หากกำไรเป็นที่พอรับได้ โดยมีตั้งกำไร TP และตั้ง SL ไม่ไกลจากแนวรับแนวต้านเดิม ทั้งใน TF1H และ 4H และจะทำการล๊อคกำไรจาก TSL ด้วยระดับหนึ่ง
ประสบการณ์: เน้นการถืออออเดอร์โดยปิดจบรายวัน และเน้นเก็บกำไรแบบเป็นรอบสวิงเทรนไซด์เวย์ เพื่อเป็นการเพิ่มกระแสเงินสด แคชโฟร์ ในพอร์ต อาจมีการแบ่งปิดกำไรจากออเดอร์ที่กำไรในระดับหนึ่งแล้ว อาจมีการตั้ง TSL เพื่อเป็นการล๊อคกำไรได้ในอีกทางหนึ่งด้วย
เพื่อนๆคิดว่าตลาดตอนนี้เป็นขาขึ้น ( Bullish)หรือขาลง (Bearish)ครับ คอมเม้นท์ด้านล่างไว้ได้เลย !!!
“หากบทวิเคราะห์นี้ดี…มีประโยชน์กับเพื่อนๆนักเทรดทุกท่าน
กรุณากดติดตามและสนับสนุนพวกเราด้วยนะครับ…ขอบคุณครับผม”

BTC 4H Engulfing GameHTF : 4H เกิด Engulfing
LTF : Demand แรกของ 61.8 , ในรูปคือ Fu Candle (Demand แบบชักไส้)
Entry : เลื่อน RR ให้ได้ 4:1 เพราะเทรดแต่ RR นี้เสมอ
TP 23.6 เสมอ , RR 4:1

BTC/USDT – Technical View (30m) Bitcoin เริ่มดีดจากแนวรับหลัก Bitcoin เริ่มดีดจากแนวรับหลัก!
แรงซื้อเริ่มกลับเข้ามา มีลุ้นรีบาวด์ขึ้นทดสอบแนวต้านถัดไป
🔹 โครงสร้างราคา (Market Structure):
ราคาเริ่มฟื้นจาก Sideway Base หลังพักตัวต่อเนื่อง
เส้น EMA เริ่มโค้งขึ้น ขณะที่ RSI ดีดกลับจากโซน Oversold
เกิดการ ยก Low ใหม่ เป็นสัญญาณเปลี่ยนโมเมนตัมระยะสั้น
มีโอกาสเกิด Short-Term Reversal เพื่อเทสโซนแนวต้าน
🟥 แนวรับ (Support):
$101,000 – $102,000
โซน Demand หลัก ที่ราคาเคยยืนได้อย่างแข็งแรงในรอบก่อน
🟦 แนวต้าน (Resistance):
$107,000 – $108,500
โซน Supply Zone เดิม ที่เคยเป็นจุดกลับตัวลงของราคา
🎯 Take Profit (TP):
TP1 : $106,000
TP2 : $108,000
📌 กลยุทธ์ (Strategy):
รอ รีเทสต์แนวรับ $102k แล้วยืนได้ = จังหวะ Buy Setup
วาง Stop Loss ใต้ $100k
ทยอยขายทำกำไรเมื่อราคาเข้าสู่กรอบแนวต้าน $107k – $108.5k
หากเบรค EMA200 ขึ้นได้ โอกาสสูงที่จะเปลี่ยนโครงสร้างเป็น Uptrend Phase
📈 มุมมองรวม (Technical Outlook):
BTC เริ่มแสดงสัญญาณ ฟื้นตัวในกรอบ Sideway ขึ้น
แรงขายเริ่มลดลง และแรงซื้อกลับเข้ามาชัดเจน
หากสามารถยืนเหนือ $102k ได้มั่นคง มีโอกาสไปทดสอบแนวต้าน $108k อีกครั้ง
#BTC #Bitcoin #CryptoTrading #TechnicalAnalysis #MarketStructure #SupportResistance #PriceAction #CryptoStrategy #BullishSetup #TradingPlan #TradingView #CryptoMarket #BTCUSDT #MarketUpdate #CryptoOutlook

เราแนะนำให้ซื้อทองคำเมื่อราคาปรับตัวลดลงทองคำยังคงรักษากรอบการซื้อขายที่กว้าง โดยปรับตัวเพิ่มขึ้นเล็กน้อยในกราฟรายวันวันศุกร์ ราคามีแนวรับเหนือเส้นค่าเฉลี่ยเคลื่อนที่ 5 วัน โดยเส้นค่าเฉลี่ยเคลื่อนที่ 10 วันและ 7 วันอยู่ที่ประมาณ 3,980 จุด ตัวบ่งชี้ RSI กำลังอยู่เหนือเส้นกลาง ในกราฟระยะสั้น 4 ชั่วโมงและรายชั่วโมง เส้น Bollinger Bands กำลังขยายตัวขึ้น โดยราคาซื้อขายใกล้กับเส้นบน ปัจจุบันทองคำอยู่ใกล้ขอบบนของกรอบการซื้อขายที่ 4,050 จุด!
เมื่อพิจารณาจากกราฟรายชั่วโมง แนวโน้มขาขึ้นก่อนหน้านี้ของทองคำได้ถูกทำลายลงแล้ว มีการดีดตัวขึ้นอย่างแข็งแกร่งที่ 4,050 จุดในช่วงการซื้อขายของตลาดเอเชีย แต่แนวรับโดยรวมของทองคำอยู่ที่ 3,965 จุด ดังนั้น แนวโน้มขาขึ้นของทองคำน่าจะยังคงดำเนินต่อไป แต่ควรให้ความสนใจกับแนวรับสำคัญ แนะนำให้ซื้อเมื่อราคาปรับตัวลดลง ในแง่ของปริมาณการซื้อขาย ปริมาณการซื้อขายในวันศุกร์ค่อนข้างสมดุล ดังนั้นเราจึงต้องติดตามว่าปริมาณการซื้อขายจะเพิ่มขึ้นอีกหรือไม่ นี่อาจบ่งชี้ถึงจุดเปลี่ยนที่อาจเกิดขึ้นในตลาดทองคำ โดยอาจเกิดการปรับตัวขึ้นในระยะสั้นได้
ระดับสำคัญ:
แนวรับแรก: 4030, แนวรับที่สอง: 3992, แนวรับที่สาม: 3975
แนวต้านแรก: 4046, แนวต้านที่สอง: 4075, แนวต้านที่สาม: 4140
กลยุทธ์การซื้อขายทองคำ:
ซื้อ: 3975-3980, SL: 3965, ราคาเป้าหมาย: 4000-4010;
ขาย: 4075-4080, SL: 4090, ราคาเป้าหมาย: 4060-4050;
การวิเคราะห์เพิ่มเติม →

วุฒิสภาพร้อมที่จะยุติการปิดรัฐบาล? คัมแบ็กดัชนีราคาผู้ค้าตาทำลาย:พรรคประชาธิปัตย์วุฒิสภาอาจพร้อมที่จะสนับสนุนแพคเกจของการใช้จ่ายค่าใช้จ่ายและมาตรการการระดมทุนระยะสั้น,หมายความว่าการปิดตัวของรัฐบาลที่ยาวที่สุดในประวัติศาสตร์เร็วๆนี้จะมาถึงจุดสิ้นสุด.
ดัชนีราคาผู้บริโภคที่จะเกิดขึ้น(ดัชนีราคาผู้บริโภค)การเปิดตัวจะเป็นจุดข้อมูลที่สำคัญสำหรับตล อย่างไรก็ตามการปิดเครื่องได้หยุดชะงักการเก็บรวบรวมข้อมูลแล้ว นส่วนของข้อมูลอัตราเงินเฟ้ออาจจะล่าช้าหรือถูกต้องน้อยกว่าปกติ
เปอร์เซนต์รายการสั่งซื้อ เปอร์เซนต์รายการสั่งซื้อ

XAU/USD: BREAKOUT! ทะลุแนวต้านสำคัญ มุ่งสู่ $4,120📊 Timeframe: H4 (Swing Trading) | 10 - 14 พฤศจิกายน 2568 |
วันที่: 10 พฤศจิกายน 2568 | 14:18 น.
📌 ภาพรวมปัจจัยพื้นฐาน (FUNDAMENTAL OUTLOOK):
▪️ ปัจจัยหนุน (BULLISH): ตลาดยังคงเพิ่มการคาดการณ์การลดอัตราดอกเบี้ยของ FED (RATE CUT BETS) หลังตัวเลขเศรษฐกิจสหรัฐฯ อ่อนแอลง ซึ่งลดต้นทุนการถือครองทองคำ
▪️ ปัจจัยกดดัน (BEARISH): วุฒิสภาสหรัฐฯ กำลังลงคะแนนเพื่อยุติ US GOVERNMENT SHUTDOWN หากสำเร็จจะลดความกังวลในตลาด (RISK-OFF) และกดดันราคาทองคำในฐานะ SAFE-HAVEN
▪️ ข้อสังเกต: การผ่อนคลายความตึงเครียดทางการค้าระหว่างสหรัฐฯ และจีนก็เป็นอีกปัจจัยที่อาจฉุดราคาลงในระยะสั้น
📌 ภาพรวมแนวโน้มทางเทคนิค H4 (TECHNICAL TREND):
▪️ แนวโน้มหลัก: ราคาทองคำได้ ฟื้นตัวและทะลุแนวต้าน (BREAKOUT) อย่างชัดเจนในช่วงเปิดสัปดาห์ บ่งชี้ถึงโมเมนตัมขาขึ้นที่แข็งแกร่ง (STRONG BULLISH MOMENTUM)
▪️ ทิศทางปัจจุบัน: ราคากำลังทดสอบแนวต้านสำคัญที่ $4087 และมีเป้าหมายหลักในการทดสอบโซน SUPPLY ถัดไป
▪️ สัญญาณ RSI: RSI อยู่ในโซน OVERBOUGHT (80.93) ซึ่งเตือนถึงความเสี่ยงของการขายทำกำไร (PROFIT-TAKING SELL-OFF) ในระยะสั้น
📌 แนวรับและแนวต้านสำคัญ (SUPPORT & RESISTANCE) H4:
* แนวต้าน (RESISTANCE):
* R1 (KEY ZONE): $4120 - $4144 (โซน SUPPLY หลัก/เป้าหมายถัดไป)
* R2 (MAJOR TARGET): $4166
* แนวรับ (SUPPORT):
* S1 (BREAKOUT LEVEL/DEMAND): $4019 - $4029 (แนวต้านเดิมที่เปลี่ยนเป็นแนวรับ)
* S2 (MID-TERM): $3955 - $3960
* S3 (MAJOR DEMAND): $3920
🚨 ข้อเสนอแนะในการปรึกษาและวางแผน:
ในสภาวะที่ราคาเกิด BREAKOUT และ RSI อยู่ในโซน OVERBOUGHT การบริหารความเสี่ยงเป็นสิ่งสำคัญสูงสุด
* คำแนะนำ: หากท่านตัดสินใจเข้า POSITION ในบริเวณราคาที่กำหนด โปรดปรึกษาเพื่อวางแผนบริหารความเสี่ยงในการตั้งค่า STOPLOSS และ LOT SIZE ให้เหมาะสม โดยพิจารณาความเสี่ยงของการดีดตัวกลับ (PULLBACK) จากโซน OVERBOUGHT

ฝึกวิเคราะห์เพื่อหาจุดเข้าซื้อให้แม่นยำยิ่งๆขึ้นไปกำหนดแผนรูปแบบตามเงื่อนไขข้อบังคับของตัวเองแล้วรอจนเข้าเงื่อนไขในการเข้าออเดอร์และ money management
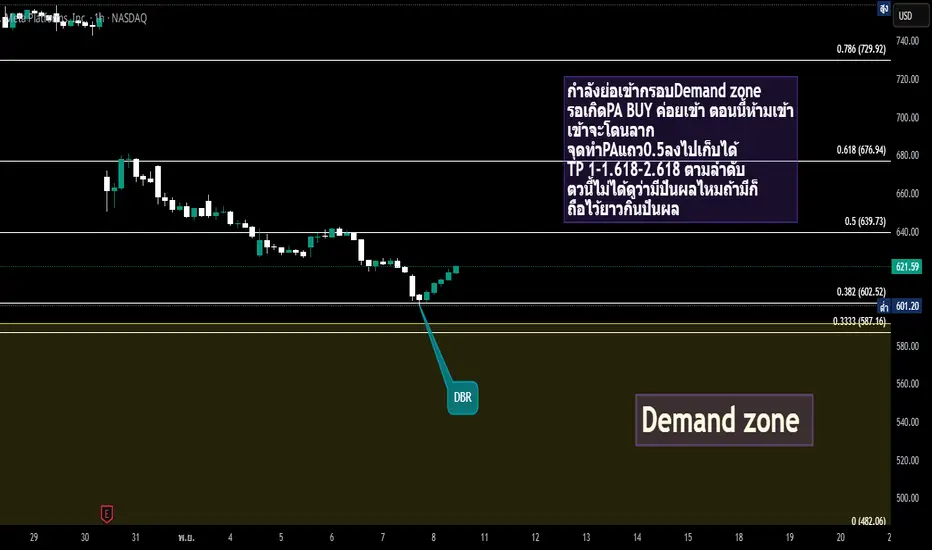
CLSK US🌎CleanSpark เป็นบริษัทที่เชี่ยวชาญด้านการขุด Bitcoin และโซลูชันพลังงานสะอาด
ในไตรมาสที่ 3 ปี 2025 CleanSpark รายงานรายได้สูงสุดเป็นประวัติการณ์ที่ 198.6 ล้านดอลลาร์สหรัฐ (เพิ่มขึ้น 91% เมื่อเทียบกับปีก่อนหน้า) และมีกำไรสุทธิ 257.4 ล้านดอลลาร์สหรัฐ
ในไตรมาสที่ 1 ปี 2025 รายได้อยู่ที่ 162.3 ล้านดอลลาร์สหรัฐ (เพิ่มขึ้น 120% เมื่อเทียบกับปีก่อนหน้า) และมีกำไรสุทธิ 246.8 ล้านดอลลาร์สหรัฐ
บริษัทมีอัตราแฮชเรตปฏิบัติการ (EH/s) อยู่ที่ 50 EH/s ในเดือนมิถุนายน 2025 กลายเป็นบริษัทขุดเหรียญสาธารณะรายแรกที่บรรลุเป้าหมายนี้โดยใช้โครงสร้างพื้นฐานของสหรัฐอเมริกาเพียงอย่างเดียว ซึ่งทำให้บริษัทมีอัตราแฮชเรต Bitcoin ประมาณ 5.8% ของอัตราแฮช Bitcoin ทั่วโลก
ณ เดือนมิถุนายน 2025 CleanSpark ถือครอง Bitcoin จำนวน 12,703 BTC (มูลค่าประมาณ 1.08 พันล้านดอลลาร์สหรัฐ) ทำให้เป็นหนึ่งในบริษัทที่ถือครอง Bitcoin รายใหญ่ที่สุด
บริษัทได้เริ่มใช้กลยุทธ์อนุพันธ์เพื่อป้องกันความเสี่ยงและเพิ่มผลตอบแทนจากคลัง Bitcoin ของตน
CleanSpark กำลังขยายกำลังการผลิตอย่างแข็งขันในรัฐจอร์เจีย เทนเนสซี และไวโอมิง ซึ่งเป็นรัฐที่มีพลังงานราคาถูกและยั่งยืน
บริษัทวางแผนที่จะบรรลุระดับ 57 EH/s ภายในสิ้นปี 2568 และมีศักยภาพที่จะขยายเป็น 60+ EH/s
CleanSpark ได้ระดมทุน 650 ล้านดอลลาร์สหรัฐผ่านตราสารหนี้แปลงสภาพ 0% ซึ่งเป็นเงินทุนสนับสนุนการเติบโตของบริษัทอย่างเต็มที่สู่ระดับ 50 EH/s โดยไม่ทำให้สัดส่วนการถือหุ้นลดลง
ด้วยการแข่งขันที่เพิ่มขึ้นในอุตสาหกรรมเหมืองแร่ CleanSpark อาจฉวยโอกาสจากการเข้าซื้อกิจการของผู้เล่นที่อ่อนแอกว่า เพื่อเสริมสร้างความแข็งแกร่งให้กับสถานะทางการตลาดของบริษัท

EURUSD 4H – เขตสภาพคล่องก่อน US CPI & คำพูดเฟด💶 EURUSD – Weekly Smart Money Outlook | by Ryan_TitanTrader
📈 บริบทตลาด (Market Context)
สัปดาห์นี้โฟกัสไปที่ตัวเลขเงินเฟ้อสหรัฐฯ (US CPI) และถ้อยแถลงจากเฟด ซึ่งมักกระตุ้นการแกว่งตัวของดอลลาร์และคู่เงินหลักอย่าง EURUSD โครงสร้าง 4H ล่าสุดแสดงแรงฟื้นจากขาลงก่อนหน้า แต่ยังคงมีสภาพคล่องสะสมอยู่ทั้งด้านบนและล่างของกรอบราคา ทำให้มีโอกาสเกิด “liquidity sweep” ก่อนเลือกทิศทางหลัก รูปแบบแบบ SMC จึงเน้นรอให้ราคาวิ่งเก็บสภาพคล่องในโซนพรีเมียมหรือดิสเคานต์ แล้วค่อยคอนเฟิร์มด้วยสัญญาณโครงสร้างย่อย
🔎 มุมมองเทคนิค (4H / SMC View)
• โครงสร้างก่อนหน้าเป็นขาลงชัดเจนตาม “previous down swing” ก่อนเกิดแรงดีดพร้อม ChoCH/BOS ย่อยบ่งชี้แรงซื้อกลับ
• ด้านบนมีชั้นสภาพคล่องเหนือยอดเท่ากัน ใกล้โซนพรีเมียม 1.16260–1.16258 ซึ่งเอื้อต่อการ “engineered sweep” เพื่อดันราคาลงสั้น ๆ
• ด้านล่างมี Discount Demand/Buy Zone ที่ 1.14625–1.14627 ทับซ้อนฐานโครงสร้างเก่า เหมาะสำหรับการสะสมออเดอร์ขาขึ้นรอบใหม่
• คาดเห็นการไล่สภาพคล่องกลางกรอบก่อนข่าว และค่อยตัดสินทิศด้วยโครงสร้าง timeframe ย่อย
🟢 Buy Zone: 1.14625–1.14627
SL: 1.14620
TP เป้าหมาย: 1.15295 → 1.15552 → 1.15911 → 1.16321
เหตุผล:
• อยู่ในโซนดิสเคานต์ของกรอบ 4H และตรงกับฐานปฏิกิริยาเดิม
• มีสภาพคล่องค้างใต้โลว์ ให้โอกาสสะสมก่อนดันขึ้น
• สอดคล้องกับสัญญาณกลับตัวจาก ChoCH/BOS ย่อย
🔴 Sell Liquidity Zone: 1.16260–1.16258
SL: 1.16267
TP เป้าหมาย: 1.15911 → 1.15552 → 1.15295 → 1.14734
เหตุผล:
• โซนพรีเมียมเหนือ equal highs เหมาะกับ “sweep แล้วกระจาย” ระยะสั้น
• ตรงกับแนวปฏิเสธราคาในอดีตของกรอบ 4H
• เอื้อให้เกิดการเก็บสภาพคล่องก่อนปรับฐานลง
⚠️ หมายเหตุบริหารความเสี่ยง
• รอคอนเฟิร์ม M15 ด้วย ChoCH/BOS/ค่าโครงสร้างภายในโซนก่อนเข้าซื้อขาย
• ระวังการปั่นสภาพคล่องช่วงก่อน–หลังตัวเลขสหรัฐฯ โดยเฉพาะรอบเปิด US Session
• เลี่ยงเข้าออเดอร์ล่วงหน้า 10–15 นาทีช่วงประกาศสำคัญเพื่อลดการสเปรดกว้าง
• ทยอยทำกำไรบางส่วนที่แต่ละเป้าหมาย เพื่อคง “runner” ไว้หากเกิดเทรนด์ต่อเนื่อง
✅ สรุป
EURUSD ยังเล่นในกรอบ 4H ที่มีรอยเท้าสถาบันชัดเจนทั้งด้านบนและล่าง กลยุทธ์แบบ SMC คือปล่อยให้ราคาเก็บสภาพคล่องที่พรีเมียม 1.16260–1.16258 เพื่อหาจังหวะขายลง หรือรอรับดิสเคานต์ 1.14625–1.14627 เพื่อเข้าซื้อสะสม ยืนยันด้วยสัญญาณ timeframe ย่อย แล้วคุมความเสี่ยงอย่างเคร่งครัด
🔔 ติดตาม RYAN_TITANTRADER เพื่ออัปเดต SMC รายวัน ⚡

SET50 Insights: ส่องทิศทาง S50Z25 ผ่านเลนส์ Data&AI | 11 พ.ย. 68🔥🔥ลุ้นข้ามต้าน 850 ! ฟอร์มขาขึ้นทางเทคนิคอีกครั้ง
📌 Data Checkpoints - เหตุการณ์สำคัญวันก่อน
🔴 ขึ้นทดสอบแนวต้านขาลงถึง3รอบตลอดทั้งวัน ยังไม่ผ่าน(แต่ใกล้แล้ว)
🔴 DELTA ตัวถ่วง ลงสวนตลาด
🔴 ต่างชาติขายไม่พัก วันที่3ติดต่อกัน อีก1,000ล้าน
🟢 มี Pattern Invesrse H&S เกิดขึ้น
🟢 ต่างประเทศขึ้นต่อ ลุ้นเปิดบวก
🟢 เก็งกำไรประกาศงบ คาดงบดีหนุนโทนบวก
⸻⸻
📉 Outlook&Tactical Plan - ภาพรวมแนวโน้มวันนี้
🔹Trend : วันนี้มีสิทธิเปิดโดดข้าม Trend Line(เส้นแดง) กลับไปฟอร์มตัวขาขึ้นกรอบเขียว โดยมี Pattern Inverted H&S สนับสนุน
🟢 Bullish Plan :
เทคนิคสวยกว่า ! หากย่อลงไม่หลุด 848-850 เลี้ยงตัวบน Trend line ลุ้นเก็บ
หรือ Follow ตามเมื่อผ่านแนวต้าน
🔴 Bearish Plan :
เชื่อพลังต่างชาติขาย ! มองไม่ผ่าน 853–855 แล้ว RSI เริ่มอ่อนตัว
มีโอกาสเห็นแรงขายพักฐานกลับลงมา 845–848
🟡 Sideway Plan :
หากราคาแกว่งในกรอบแคบระหว่าง 845–853
ถือเป็นช่วง “สะสมพลัง” ก่อนเลือกทาง
⸻⸻
🎯 Key levels - โซนราคาสำคัญ
🛡️แนวรับ (Support) : 845-847 (จุดร่วม 8 Indicators)
⚔️แนวต้าน (Resistant) : 851-853 (จุดร่วม 6 Indicators)
*ดูจุดร่วมทางเทคนิคได้จากตาราง Price Distribution ในคอมเมนต์
⸻⸻
⚡ AI Probability & Forecast – คาดการณ์เหตุการณ์ที่น่าสนใจ
🔹 45% → Bullish Breakout (ผ่าน 853 ขึ้นสู่ 861–866)
หากราคาทะลุ Neckline พร้อม RSI > 55
🔹 35% → Sideway Consolidation (แกว่ง 845–853)
ตลาดรอแรงขับใหม่หลังดีดขึ้นแรงหลายวัน
คาดจะพักตัวบริเวณเส้น EMA25–75
🔹 20% → Bearish Pullback (พักฐานลง 841–837)
หากไม่สามารถยืนเหนือ 848 ได้และ MACD ตัดลง
มีโอกาสพักตัวสั้น ๆ ก่อนกลับมารีบาวด์
👀 สรุป : แรงซื้อช่วงบ่ายเมื่อวานทำเกมเปลี่ยนภาพเทคนิคกลับมาดูดี DELTA,หุ้นใหญ่ที่ลุ้นประกาศงบอาจกลับมาช่วยหนุนตลาด ถ้าวันนี้ยืน 850 หรือทะลุ 855 ได้ เสริมแรงบวกระยะสั้นต่อทั้งสัปดาห์
#TFEX #S50Z25 #SET #หุ้น #หุ้นไทย #ตลาดหุ้น #SET50 #derivatives
