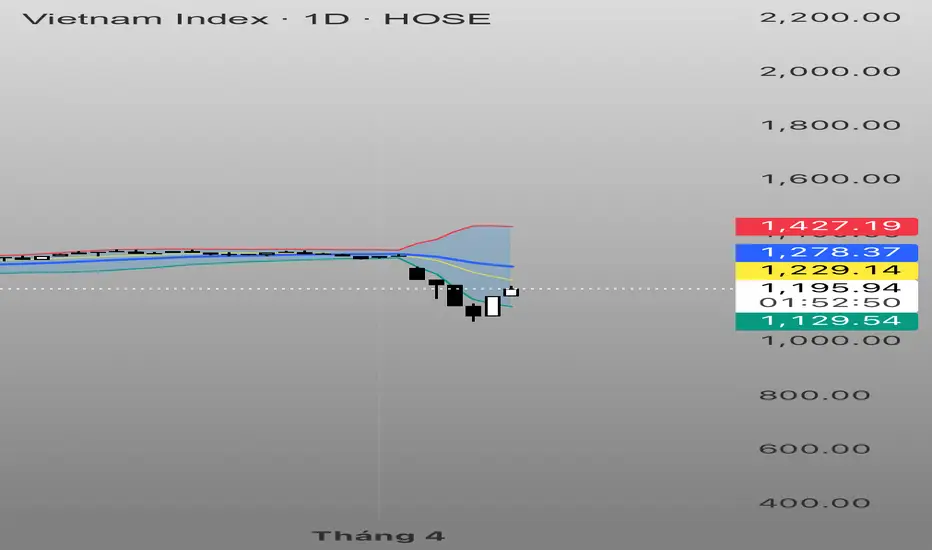
//version=5
strategy("XAUUSD M15 Bollinger + ATR Strategy", overlay=true, margin_long=100, margin_short=100)
// --- Input Parameters ---
var float bb_length = input.int(20, "Bollinger Bands Length", minval=1)
var float bb_mult = input.float(2.0, "Bollinger Bands Multiplier", minval=0.1, step=0.1)
var float atr_length = input.int(14, "ATR Length", minval=1)
var float lot_size = input.float(0.1, "Lot Size", minval=0.01, step=0.01)
// --- Indicators ---
[float sma, float upper, float lower] = ta.bb(close, bb_length, bb_mult)
float atr = ta.atr(atr_length)
// --- Trading Logic ---
var float entry_price = 0.0
var float sl_price = 0.0
var float tp_price = 0.0
// Buy Condition: Close above Upper Band
if (ta.crossover(close, upper))
entry_price := close
sl_price := close - atr
tp_price := close + atr
strategy.entry("Buy", strategy.long, qty=lot_size)
strategy.exit("Exit Buy", "Buy", stop=sl_price, limit=tp_price)
// Sell Condition: Close below Lower Band
if (ta.crossunder(close, lower))
entry_price := close
sl_price := close + atr
tp_price := close - atr
strategy.entry("Sell", strategy.short, qty=lot_size)
strategy.exit("Exit Sell", "Sell", stop=sl_price, limit=tp_price)
// --- Plot Bollinger Bands and ATR ---
plot(sma, "SMA", color=color.blue)
plot(upper, "Upper Band", color=color.red)
plot(lower, "Lower Band", color=color.green)
plot(atr, "ATR", color=color.purple, style=plot.style_histogram, display=display.bottom)
// --- Performance Statistics ---
var table stats_table = table.new(position.top_right, 5, 7, border_width=1)
if (barstate.islastconfirmed)
table.cell(stats_table, 0, 0, "Metric", text_color=color.white, bgcolor=color.gray)
table.cell(stats_table, 0, 1, "Total Trades", text_color=color.white, bgcolor=color.gray)
table.cell(stats_table, 0, 2, "Win Rate (%)", text_color=color.white, bgcolor=color.gray)
table.cell(stats_table, 0, 3, "Net Profit", text_color=color.white, bgcolor=color.gray)
table.cell(stats_table, 0, 4, "Profit Factor", text_color=color.white, bgcolor=color.gray)
table.cell(stats_table, 0, 5, "Max Drawdown", text_color=color.white, bgcolor=color.gray)
table.cell(stats_table, 0, 6, "Avg Trade", text_color=color.white, bgcolor=color.gray)
table.cell(stats_table, 1, 0, "Value", text_color=color.white, bgcolor=color.black)
table.cell(stats_table, 1, 1, str.tostring(strategy.closedtrades), text_color=color.white, bgcolor=color.black)
table.cell(stats_table, 1, 2, str.tostring(math.round(strategy.winners / math.max(strategy.closedtrades, 1) * 100, 2)), text_color=color.white, bgcolor=color.black)
table.cell(stats_table, 1, 3, str.tostring(math.round(strategy.netprofit, 2)), text_color=color.white, bgcolor=color.black)
table.cell(stats_table, 1, 4, str.tostring(math.round(strategy.grossprofit / math.max(strategy.grossloss, 1), 2)), text_color=color.white, bgcolor=color.black)
table.cell(stats_table, 1, 5, str.tostring(math.round(strategy.max_drawdown, 2)), text_color=color.white, bgcolor=color.black)
table.cell(stats_table, 1, 6, str.tostring(math.round(strategy.netprofit / math.max(strategy.closedtrades, 1), 2)), text_color=color.white, bgcolor=color.black)
// --- Plot Entry/Exit Signals ---
plotshape(ta.crossover(close, upper), "Buy Signal", style=shape.triangleup, location=location.belowbar, color=color.green, size=size.small)
plotshape(ta.crossunder(close, lower), "Sell Signal", style=shape.triangledown, location=location.abovebar, color=color.red, size=size.small)
คำจำกัดสิทธิ์ความรับผิดชอบ
ข้อมูลและบทความไม่ได้มีวัตถุประสงค์เพื่อก่อให้เกิดกิจกรรมทางการเงิน, การลงทุน, การซื้อขาย, ข้อเสนอแนะ หรือคำแนะนำประเภทอื่น ๆ ที่ให้หรือรับรองโดย TradingView อ่านเพิ่มเติมที่ ข้อกำหนดการใช้งาน
คำจำกัดสิทธิ์ความรับผิดชอบ
ข้อมูลและบทความไม่ได้มีวัตถุประสงค์เพื่อก่อให้เกิดกิจกรรมทางการเงิน, การลงทุน, การซื้อขาย, ข้อเสนอแนะ หรือคำแนะนำประเภทอื่น ๆ ที่ให้หรือรับรองโดย TradingView อ่านเพิ่มเติมที่ ข้อกำหนดการใช้งาน
