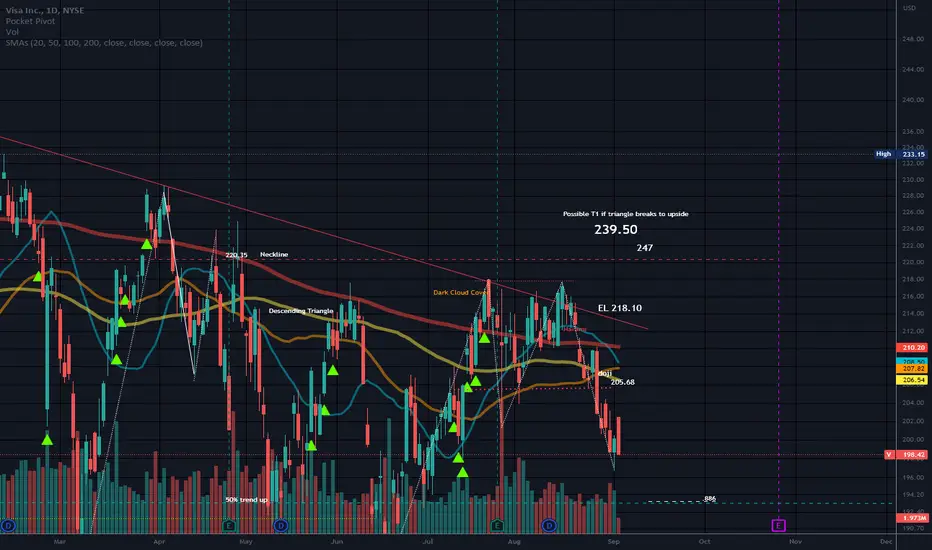
Price appears to be in a large Descending Triangle.
Neutral pattern until a trendline is broken.
Prior Head and Shoulders pattern.
Targets in orange below price are for a break of support of the triangle.
There is a Double bottom at the support line of the triangle.
Possible M structure forming. It is too early to tell.
Gaps noted below support line.
Price is still above the 50% level of the trend up measured from the Flu low.
No recommendation.
MA's chart is similar.
คำจำกัดสิทธิ์ความรับผิดชอบ
ข้อมูลและบทความไม่ได้มีวัตถุประสงค์เพื่อก่อให้เกิดกิจกรรมทางการเงิน, การลงทุน, การซื้อขาย, ข้อเสนอแนะ หรือคำแนะนำประเภทอื่น ๆ ที่ให้หรือรับรองโดย TradingView อ่านเพิ่มเติมที่ ข้อกำหนดการใช้งาน
คำจำกัดสิทธิ์ความรับผิดชอบ
ข้อมูลและบทความไม่ได้มีวัตถุประสงค์เพื่อก่อให้เกิดกิจกรรมทางการเงิน, การลงทุน, การซื้อขาย, ข้อเสนอแนะ หรือคำแนะนำประเภทอื่น ๆ ที่ให้หรือรับรองโดย TradingView อ่านเพิ่มเติมที่ ข้อกำหนดการใช้งาน