Pre - US Recession Behaviour
Recessions and the Fed’s First Rate Cut
Recessions in the United States typically begin after the Federal Reserve cuts interest rates for the first time. On average, a recession starts roughly six months after that initial rate cut—at least since 1981.
This analysis focuses on a recurring pattern that has been observable since September 1973. However, the pattern becomes far clearer before and after the Gulf War recession of 1990. Before that period, the pattern was still present, though individual events occurred almost simultaneously—particularly during the 1973 oil embargo recession and the double-dip recession of 1980–1981. For this reason, the analysis will emphasize U.S. recessions that occurred after 1990.
The Observed Pattern
The pattern I noticed is as follows: prior to the Fed’s initial rate cut, U.S. 10-year Treasury yields (US10Y) typically peaked about 14.25 months earlier, and the U.S. CPI year-over-year rate (USIRYY) also peaked around the same time.
Interest rates generally plateaued for an average of 8.25 months before the first rate cut (this average is based on recessions from 1990–2020). During this plateau phase, US10Y yields either declined further or moved within a narrow range—and the same applies to USIRYY (CPI YoY).
After the Fed’s first rate cut, both interest rates and US10Y yields declined, while USIRYY began to rise. This reaction is logical: as financial conditions ease, inflation tends to pick up again until it eventually peaks and is then suppressed as the economy weakens.
The 1990 Anomaly
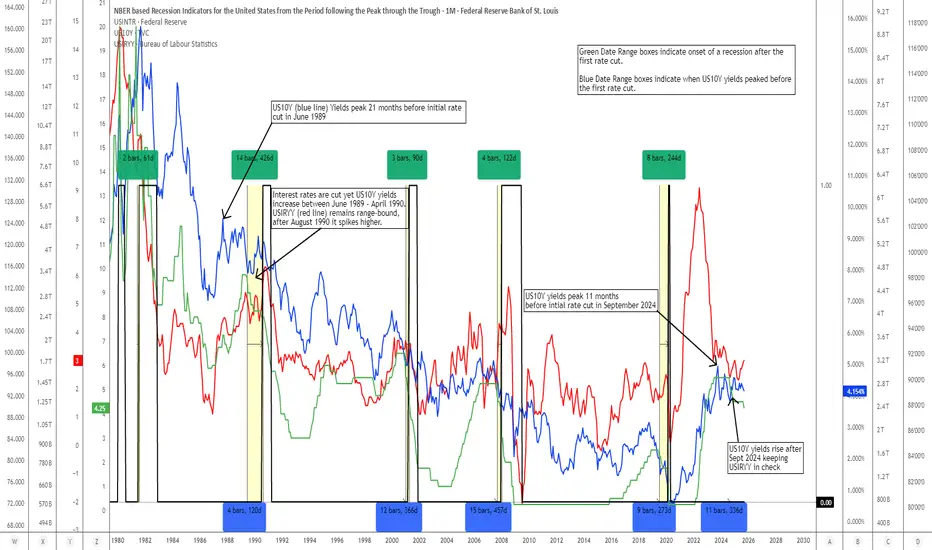
However, in 1990 and 2024, a notable anomaly emerged. Following the Fed’s first rate cut, USIRYY did not rise—it stagnated. This can be observed between June 1989 (the Fed’s first cut) and August 1990 (the onset of the Gulf War recession).
What kept inflation sticky and stagnant was that US10Y yields remained elevated, effectively acting as a brake on inflation. In other words, the bond market was doing the Fed’s job—tightening financial conditions without the Fed needing to keep nominal interest rates (USINTR) high.
But this balancing act could not last forever. By late July 1990, US10Y yields dropped below their February 1990 level, which allowed inflation to spike briefly before following interest rates and yields lower after November 1990.
The Pattern Repeats (2024–2025)
This pre-1990 Gulf War recession pattern is now re-emerging. In September 2024, the Fed cut rates for the first time. As if on cue, US10Y yields had peaked roughly 11 months earlier, and inflation had already fallen significantly.
By the end of September 2024:
US10Y yields: 3.8%
Fed funds rate: 5.0%
USIRYY: 2.4%
Fast-forward one year to September 2025:
The Fed cut rates again, down to 4.25%.
USIRYY stood at 3.0%, about the same level seen when interest rates were between 5.25–5.50%.
Why has inflation remained relatively low despite lower policy rates? The answer lies in US10Y yields, which were 9.81% higher in September 2025 than a year earlier. Once again, elevated long-term yields are acting as a brake on inflation—essentially allowing the Fed to appear dovish while the bond market maintains tight financial conditions.
Implications
It is only a matter of time before this balancing act breaks down and a recession begins anew. While many subtle differences exist between the current cycle and the 1990 Gulf War period, the technical similarities are striking—especially regarding the interplay between lower short-term rates, elevated long-term yields, and sticky inflation.
Final Thoughts
I am not a professional macroeconomic analyst, and there are certainly far more experienced minds on this topic. I simply wanted to share this observation in the hope that others might find it useful for their own analysis.
To complement this study, I’ve created two indicators:
Financial Conditions Brake Index (FCBI) – US10Y Brake on USIRYY
Brake Pressure (FCBI – USIRYY)
I will publish these indicators and their descriptions soon. If you don’t find them immediately after reading this analysis, please be patient—I’ll upload them as soon as possible.
This is strictly a macroeconomic analysis, not a trading signal. However, monitoring how this situation evolves could offer valuable insight into what lies ahead. I will not attempt to predict the exact timing of the next recession, but current conditions appear precarious: interest rates are declining, inflation remains sticky, and the elevated US10Y yields seem to be the only factor keeping a recession at bay.
If you wish to recreate this chart, add the following comparisons:
USREC, US10Y yields, USINTR, and USIRYY.
Recessions in the United States typically begin after the Federal Reserve cuts interest rates for the first time. On average, a recession starts roughly six months after that initial rate cut—at least since 1981.
This analysis focuses on a recurring pattern that has been observable since September 1973. However, the pattern becomes far clearer before and after the Gulf War recession of 1990. Before that period, the pattern was still present, though individual events occurred almost simultaneously—particularly during the 1973 oil embargo recession and the double-dip recession of 1980–1981. For this reason, the analysis will emphasize U.S. recessions that occurred after 1990.
The Observed Pattern
The pattern I noticed is as follows: prior to the Fed’s initial rate cut, U.S. 10-year Treasury yields (US10Y) typically peaked about 14.25 months earlier, and the U.S. CPI year-over-year rate (USIRYY) also peaked around the same time.
Interest rates generally plateaued for an average of 8.25 months before the first rate cut (this average is based on recessions from 1990–2020). During this plateau phase, US10Y yields either declined further or moved within a narrow range—and the same applies to USIRYY (CPI YoY).
After the Fed’s first rate cut, both interest rates and US10Y yields declined, while USIRYY began to rise. This reaction is logical: as financial conditions ease, inflation tends to pick up again until it eventually peaks and is then suppressed as the economy weakens.
The 1990 Anomaly
However, in 1990 and 2024, a notable anomaly emerged. Following the Fed’s first rate cut, USIRYY did not rise—it stagnated. This can be observed between June 1989 (the Fed’s first cut) and August 1990 (the onset of the Gulf War recession).
What kept inflation sticky and stagnant was that US10Y yields remained elevated, effectively acting as a brake on inflation. In other words, the bond market was doing the Fed’s job—tightening financial conditions without the Fed needing to keep nominal interest rates (USINTR) high.
But this balancing act could not last forever. By late July 1990, US10Y yields dropped below their February 1990 level, which allowed inflation to spike briefly before following interest rates and yields lower after November 1990.
The Pattern Repeats (2024–2025)
This pre-1990 Gulf War recession pattern is now re-emerging. In September 2024, the Fed cut rates for the first time. As if on cue, US10Y yields had peaked roughly 11 months earlier, and inflation had already fallen significantly.
By the end of September 2024:
US10Y yields: 3.8%
Fed funds rate: 5.0%
USIRYY: 2.4%
Fast-forward one year to September 2025:
The Fed cut rates again, down to 4.25%.
USIRYY stood at 3.0%, about the same level seen when interest rates were between 5.25–5.50%.
Why has inflation remained relatively low despite lower policy rates? The answer lies in US10Y yields, which were 9.81% higher in September 2025 than a year earlier. Once again, elevated long-term yields are acting as a brake on inflation—essentially allowing the Fed to appear dovish while the bond market maintains tight financial conditions.
Implications
It is only a matter of time before this balancing act breaks down and a recession begins anew. While many subtle differences exist between the current cycle and the 1990 Gulf War period, the technical similarities are striking—especially regarding the interplay between lower short-term rates, elevated long-term yields, and sticky inflation.
Final Thoughts
I am not a professional macroeconomic analyst, and there are certainly far more experienced minds on this topic. I simply wanted to share this observation in the hope that others might find it useful for their own analysis.
To complement this study, I’ve created two indicators:
Financial Conditions Brake Index (FCBI) – US10Y Brake on USIRYY
Brake Pressure (FCBI – USIRYY)
I will publish these indicators and their descriptions soon. If you don’t find them immediately after reading this analysis, please be patient—I’ll upload them as soon as possible.
This is strictly a macroeconomic analysis, not a trading signal. However, monitoring how this situation evolves could offer valuable insight into what lies ahead. I will not attempt to predict the exact timing of the next recession, but current conditions appear precarious: interest rates are declining, inflation remains sticky, and the elevated US10Y yields seem to be the only factor keeping a recession at bay.
If you wish to recreate this chart, add the following comparisons:
USREC, US10Y yields, USINTR, and USIRYY.
คำจำกัดสิทธิ์ความรับผิดชอบ
ข้อมูลและบทความไม่ได้มีวัตถุประสงค์เพื่อก่อให้เกิดกิจกรรมทางการเงิน, การลงทุน, การซื้อขาย, ข้อเสนอแนะ หรือคำแนะนำประเภทอื่น ๆ ที่ให้หรือรับรองโดย TradingView อ่านเพิ่มเติมใน ข้อกำหนดการใช้งาน
คำจำกัดสิทธิ์ความรับผิดชอบ
ข้อมูลและบทความไม่ได้มีวัตถุประสงค์เพื่อก่อให้เกิดกิจกรรมทางการเงิน, การลงทุน, การซื้อขาย, ข้อเสนอแนะ หรือคำแนะนำประเภทอื่น ๆ ที่ให้หรือรับรองโดย TradingView อ่านเพิ่มเติมใน ข้อกำหนดการใช้งาน