WTI big picture wave structure,first 112 then 75 $ in long run
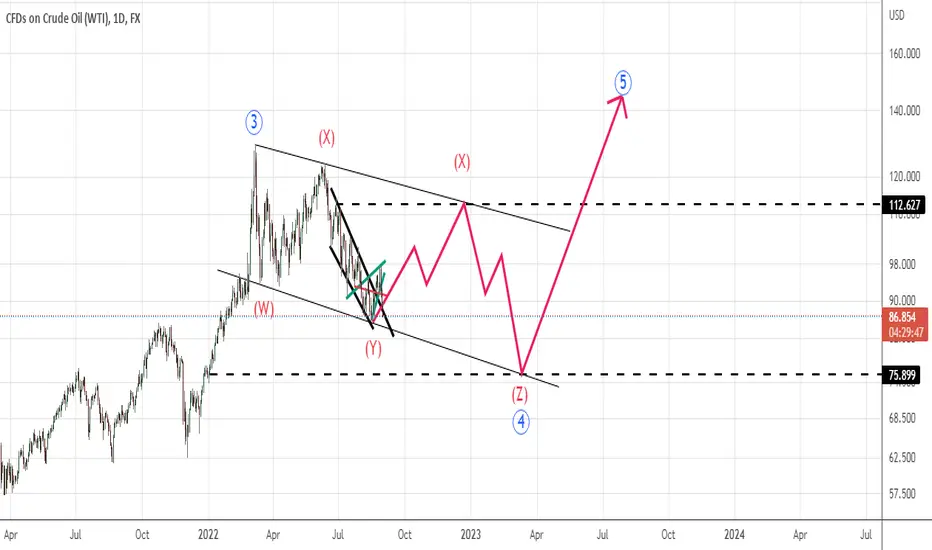
daily time frame wave count is a big picture of usoil wave sturcture as depicted on the chart indicating upward move toward 112-115 $ then going down for 75$ as these two numbers is taken from Kijensen and Tenkensen overlapped target and also our wolfe wave pattern and is in coincidence with USDCAD wave structure as below

if you have any comments about how you think for this analysis please share
thanks
if you have any comments about how you think for this analysis please share
thanks
คำจำกัดสิทธิ์ความรับผิดชอบ
ข้อมูลและบทความไม่ได้มีวัตถุประสงค์เพื่อก่อให้เกิดกิจกรรมทางการเงิน, การลงทุน, การซื้อขาย, ข้อเสนอแนะ หรือคำแนะนำประเภทอื่น ๆ ที่ให้หรือรับรองโดย TradingView อ่านเพิ่มเติมใน ข้อกำหนดการใช้งาน
คำจำกัดสิทธิ์ความรับผิดชอบ
ข้อมูลและบทความไม่ได้มีวัตถุประสงค์เพื่อก่อให้เกิดกิจกรรมทางการเงิน, การลงทุน, การซื้อขาย, ข้อเสนอแนะ หรือคำแนะนำประเภทอื่น ๆ ที่ให้หรือรับรองโดย TradingView อ่านเพิ่มเติมใน ข้อกำหนดการใช้งาน