Ulta Beauty  ULTA plans to report fiscal Q2 earnings this week at a time when its stock has risen some 70% from a 52-week intraday low reached in March. Does the stock's technical and fundamental analysis look pretty ... or will ULTA find itself needing a makeover following the numbers' release?
Let's check things out:
Ulta Beauty's Fundamental Analysis
ULTA will release results Thursday after the bell, hoping to build on the three really solid quarters in a row that it's reported relative to analyst expectations over the past nine months.
Most recently, the company's fiscal Q1 earnings release in May beat the Street's expectations for GAAP earnings per share by a whopping $0.90 while returning to year-over-year sales growth. Shares popped 11.8% the next day.
For this week's results, analysts' consensus estimate as I write this calls for ULTA to report $5.11 in fiscal Q2 GAAP earnings per share on about $5.1 billion of revenue.
Two sell-side analysts rated at five stars out of a possible five by TipRanks gave ULTA fresh votes of confidence earlier this month.
First, Susan Anderson of Canaccord Genuity reiterated her "Buy" rating and $600 price target on the stock. A few days later, Michael Lasser of UBS reiterated his "Buy" rating while increasing his target price all the way to $640 from a previous $525. (ULTA closed at $526.06 on Tuesday.)
Lasser wrote in a client note that strategic investments meant to rejuvenate ULTA's core U.S. brick-and-mortar presence are actually bearing fruit. He expects the firm to report solid top-line momentum in its latest quarter, along with an outlook that leaves open the likelihood of further earnings beats and price-target raises.
I also found it interesting that Ulta and Target TGT recently announced plans to end an arrangement under which Target sells Ulta merchandise within TGT stores.
The news seemed concerning at the time, but investors last week learned what a mess Target is when the retail giant reported poorly received quarterly results and announced plans to soon replace CEO Brian Cornell with COO Michael Fiddelke.
While Target and Ulta didn't reveal just who terminated their relationship, it's easy to see how ULTA might have wanted to disengage from the partnership.
Ulta Beauty's Technical Analysis
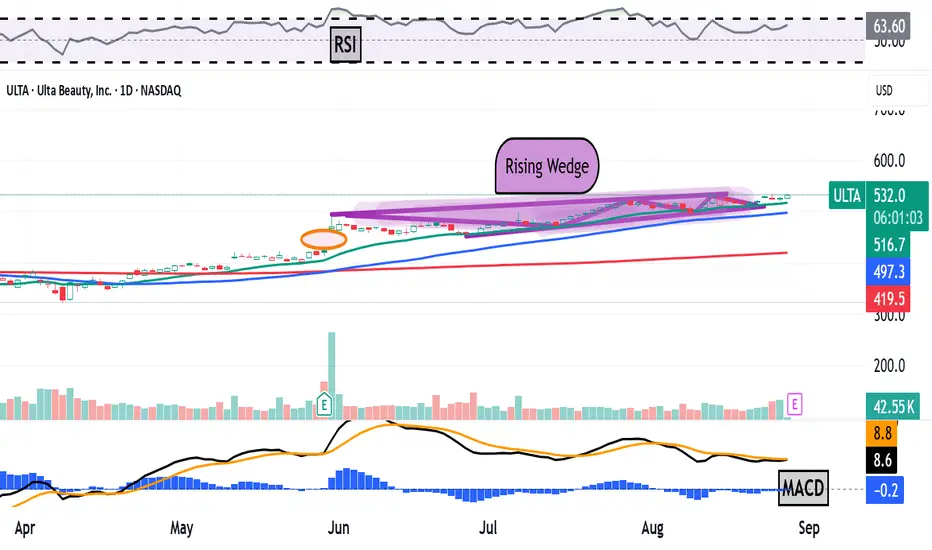
Now let's look at ULTA's chart going back some 16 months and running through Aug. 22:

Readers will see that ULTA has been in rally mode since this past March.
That said, the way that this rally developed might put the stock's upward momentum at risk.
Zooming out, we can see that ULTA struggled through a giant "double-bottom" pattern of bullish reversal, marked with a solid black line and two green boxes in the chart above. That pattern bottomed out this past March.
Shares then gapped higher with Ulta's well-received fiscal Q1 earnings release on May 29. This helped create what's called a "bullish-pennant" pattern of trend continuance, marked with green shading and a green box at the chart's right.
That's all well and good, but coming out of the pennant, the stock appears to have built a "rising-wedge" pattern of bearish reversal, as denoted by purple shading above.
ULTA has since touched the upper trendline of this wedge twice, while hitting the wedge's bottom line three times. It's typical to see two to three touches of both trendlines ahead of a breakout or breakdown from such a pattern.
Ulta's upside pivot would be the stock's $534.10 recent high, while its downside pivot would be the stock's 50-day Simple Moving Average (or "SMA," marked with a blue line at $492.10 in the chart above).
That said, a break below the 50-day SMA could lead to a test of the stock's 200-day SMA, marked with a red line at $416.60 in the chart above. That's much lower than the 50-day SMA, and running fairly close to where the gap from the stock's late May/early June run would fill.
Meanwhile, Ulta's Relative Strength Index (the gray line at the chart's top) looks solid, but not technically overbought.
However, the stock's daily Moving Average Convergence Divergence indicator (or "MACD," marked with gold and black lines and blue bars at the chart's bottom) seems problematic.
The histogram of Ulta's 9-day Exponential Moving Average (or "EMA," marked with blue bars) is in negative territory and has been in more often than not since mid-June.
Additionally, the 12-day EMA (the black line above) is currently running below the 26-day EMA (the gold line).
These are all negative technical signals, although the fact that the 12- and 26-day lines are both in positive territory does temper things a bit.
All in, this is an interesting chart ... but one that points to potential risk for Ulta.
(Moomoo Technologies Inc. Markets Commentator Stephen “Sarge” Guilfoyle had no position in ULTA at the time of writing this column.)
This article discusses technical analysis, other approaches, including fundamental analysis, may offer very different views. The examples provided are for illustrative purposes only and are not intended to be reflective of the results you can expect to achieve. Specific security charts used are for illustrative purposes only and are not a recommendation, offer to sell, or a solicitation of an offer to buy any security. Past investment performance does not indicate or guarantee future success. Returns will vary, and all investments carry risks, including loss of principal. This content is also not a research report and is not intended to serve as the basis for any investment decision. The information contained in this article does not purport to be a complete description of the securities, markets, or developments referred to in this material. Moomoo and its affiliates make no representation or warranty as to the article's adequacy, completeness, accuracy or timeliness for any particular purpose of the above content. Furthermore, there is no guarantee that any statements, estimates, price targets, opinions or forecasts provided herein will prove to be correct.
The Analyst Ratings feature comes from TipRanks, an independent third party. The accuracy, completeness, or reliability cannot be guaranteed and should not be relied upon as a primary basis for any investment decision. The target prices are intended for informational purposes only, not recommendations, and are also not guarantees of future results.
Moomoo is a financial information and trading app offered by Moomoo Technologies Inc. In the U.S., investment products and services on Moomoo are offered by Moomoo Financial Inc., Member FINRA/SIPC.
TradingView is an independent third party not affiliated with Moomoo Financial Inc., Moomoo Technologies Inc., or its affiliates. Moomoo Financial Inc. and its affiliates do not endorse, represent or warrant the completeness and accuracy of the data and information available on the TradingView platform and are not responsible for any services provided by the third-party platform.
Let's check things out:
Ulta Beauty's Fundamental Analysis
ULTA will release results Thursday after the bell, hoping to build on the three really solid quarters in a row that it's reported relative to analyst expectations over the past nine months.
Most recently, the company's fiscal Q1 earnings release in May beat the Street's expectations for GAAP earnings per share by a whopping $0.90 while returning to year-over-year sales growth. Shares popped 11.8% the next day.
For this week's results, analysts' consensus estimate as I write this calls for ULTA to report $5.11 in fiscal Q2 GAAP earnings per share on about $5.1 billion of revenue.
Two sell-side analysts rated at five stars out of a possible five by TipRanks gave ULTA fresh votes of confidence earlier this month.
First, Susan Anderson of Canaccord Genuity reiterated her "Buy" rating and $600 price target on the stock. A few days later, Michael Lasser of UBS reiterated his "Buy" rating while increasing his target price all the way to $640 from a previous $525. (ULTA closed at $526.06 on Tuesday.)
Lasser wrote in a client note that strategic investments meant to rejuvenate ULTA's core U.S. brick-and-mortar presence are actually bearing fruit. He expects the firm to report solid top-line momentum in its latest quarter, along with an outlook that leaves open the likelihood of further earnings beats and price-target raises.
I also found it interesting that Ulta and Target
The news seemed concerning at the time, but investors last week learned what a mess Target is when the retail giant reported poorly received quarterly results and announced plans to soon replace CEO Brian Cornell with COO Michael Fiddelke.
While Target and Ulta didn't reveal just who terminated their relationship, it's easy to see how ULTA might have wanted to disengage from the partnership.
Ulta Beauty's Technical Analysis
Now let's look at ULTA's chart going back some 16 months and running through Aug. 22:
Readers will see that ULTA has been in rally mode since this past March.
That said, the way that this rally developed might put the stock's upward momentum at risk.
Zooming out, we can see that ULTA struggled through a giant "double-bottom" pattern of bullish reversal, marked with a solid black line and two green boxes in the chart above. That pattern bottomed out this past March.
Shares then gapped higher with Ulta's well-received fiscal Q1 earnings release on May 29. This helped create what's called a "bullish-pennant" pattern of trend continuance, marked with green shading and a green box at the chart's right.
That's all well and good, but coming out of the pennant, the stock appears to have built a "rising-wedge" pattern of bearish reversal, as denoted by purple shading above.
ULTA has since touched the upper trendline of this wedge twice, while hitting the wedge's bottom line three times. It's typical to see two to three touches of both trendlines ahead of a breakout or breakdown from such a pattern.
Ulta's upside pivot would be the stock's $534.10 recent high, while its downside pivot would be the stock's 50-day Simple Moving Average (or "SMA," marked with a blue line at $492.10 in the chart above).
That said, a break below the 50-day SMA could lead to a test of the stock's 200-day SMA, marked with a red line at $416.60 in the chart above. That's much lower than the 50-day SMA, and running fairly close to where the gap from the stock's late May/early June run would fill.
Meanwhile, Ulta's Relative Strength Index (the gray line at the chart's top) looks solid, but not technically overbought.
However, the stock's daily Moving Average Convergence Divergence indicator (or "MACD," marked with gold and black lines and blue bars at the chart's bottom) seems problematic.
The histogram of Ulta's 9-day Exponential Moving Average (or "EMA," marked with blue bars) is in negative territory and has been in more often than not since mid-June.
Additionally, the 12-day EMA (the black line above) is currently running below the 26-day EMA (the gold line).
These are all negative technical signals, although the fact that the 12- and 26-day lines are both in positive territory does temper things a bit.
All in, this is an interesting chart ... but one that points to potential risk for Ulta.
(Moomoo Technologies Inc. Markets Commentator Stephen “Sarge” Guilfoyle had no position in ULTA at the time of writing this column.)
This article discusses technical analysis, other approaches, including fundamental analysis, may offer very different views. The examples provided are for illustrative purposes only and are not intended to be reflective of the results you can expect to achieve. Specific security charts used are for illustrative purposes only and are not a recommendation, offer to sell, or a solicitation of an offer to buy any security. Past investment performance does not indicate or guarantee future success. Returns will vary, and all investments carry risks, including loss of principal. This content is also not a research report and is not intended to serve as the basis for any investment decision. The information contained in this article does not purport to be a complete description of the securities, markets, or developments referred to in this material. Moomoo and its affiliates make no representation or warranty as to the article's adequacy, completeness, accuracy or timeliness for any particular purpose of the above content. Furthermore, there is no guarantee that any statements, estimates, price targets, opinions or forecasts provided herein will prove to be correct.
The Analyst Ratings feature comes from TipRanks, an independent third party. The accuracy, completeness, or reliability cannot be guaranteed and should not be relied upon as a primary basis for any investment decision. The target prices are intended for informational purposes only, not recommendations, and are also not guarantees of future results.
Moomoo is a financial information and trading app offered by Moomoo Technologies Inc. In the U.S., investment products and services on Moomoo are offered by Moomoo Financial Inc., Member FINRA/SIPC.
TradingView is an independent third party not affiliated with Moomoo Financial Inc., Moomoo Technologies Inc., or its affiliates. Moomoo Financial Inc. and its affiliates do not endorse, represent or warrant the completeness and accuracy of the data and information available on the TradingView platform and are not responsible for any services provided by the third-party platform.
คำจำกัดสิทธิ์ความรับผิดชอบ
ข้อมูลและบทความไม่ได้มีวัตถุประสงค์เพื่อก่อให้เกิดกิจกรรมทางการเงิน, การลงทุน, การซื้อขาย, ข้อเสนอแนะ หรือคำแนะนำประเภทอื่น ๆ ที่ให้หรือรับรองโดย TradingView อ่านเพิ่มเติมที่ ข้อกำหนดการใช้งาน
คำจำกัดสิทธิ์ความรับผิดชอบ
ข้อมูลและบทความไม่ได้มีวัตถุประสงค์เพื่อก่อให้เกิดกิจกรรมทางการเงิน, การลงทุน, การซื้อขาย, ข้อเสนอแนะ หรือคำแนะนำประเภทอื่น ๆ ที่ให้หรือรับรองโดย TradingView อ่านเพิ่มเติมที่ ข้อกำหนดการใช้งาน