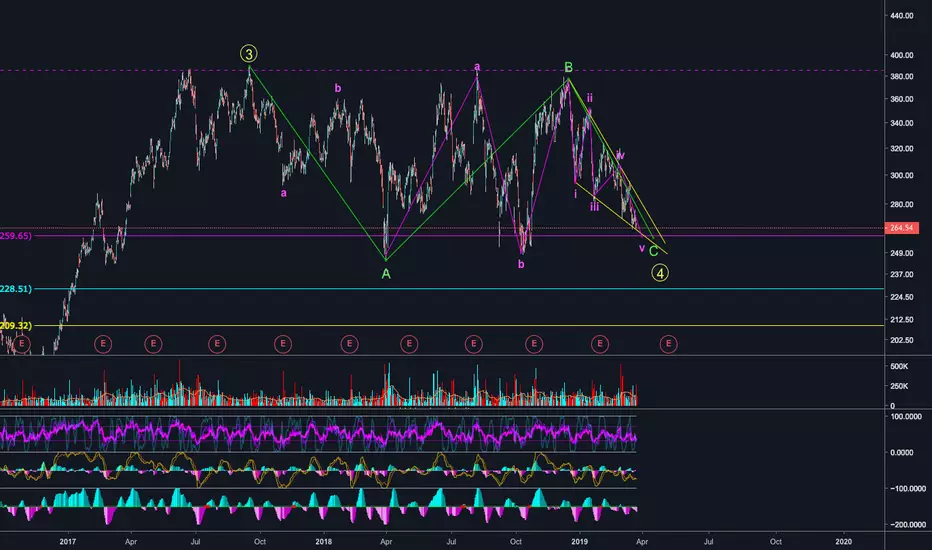
It's unclear if the wave structure is complete, but right now it looks like we have an ABC flat on both charts.
Interestingly, TSLA looks like it's in a Wave 4 (meaning up afterwards) while NIO is below its initial IPO price. So the question is, do both stocks trend together? So far the similar wave pattern would suggest it.
Interestingly, TSLA looks like it's in a Wave 4 (meaning up afterwards) while NIO is below its initial IPO price. So the question is, do both stocks trend together? So far the similar wave pattern would suggest it.
บันทึก
NIO chart:คำจำกัดสิทธิ์ความรับผิดชอบ
ข้อมูลและบทความไม่ได้มีวัตถุประสงค์เพื่อก่อให้เกิดกิจกรรมทางการเงิน, การลงทุน, การซื้อขาย, ข้อเสนอแนะ หรือคำแนะนำประเภทอื่น ๆ ที่ให้หรือรับรองโดย TradingView อ่านเพิ่มเติมที่ ข้อกำหนดการใช้งาน
คำจำกัดสิทธิ์ความรับผิดชอบ
ข้อมูลและบทความไม่ได้มีวัตถุประสงค์เพื่อก่อให้เกิดกิจกรรมทางการเงิน, การลงทุน, การซื้อขาย, ข้อเสนอแนะ หรือคำแนะนำประเภทอื่น ๆ ที่ให้หรือรับรองโดย TradingView อ่านเพิ่มเติมที่ ข้อกำหนดการใช้งาน