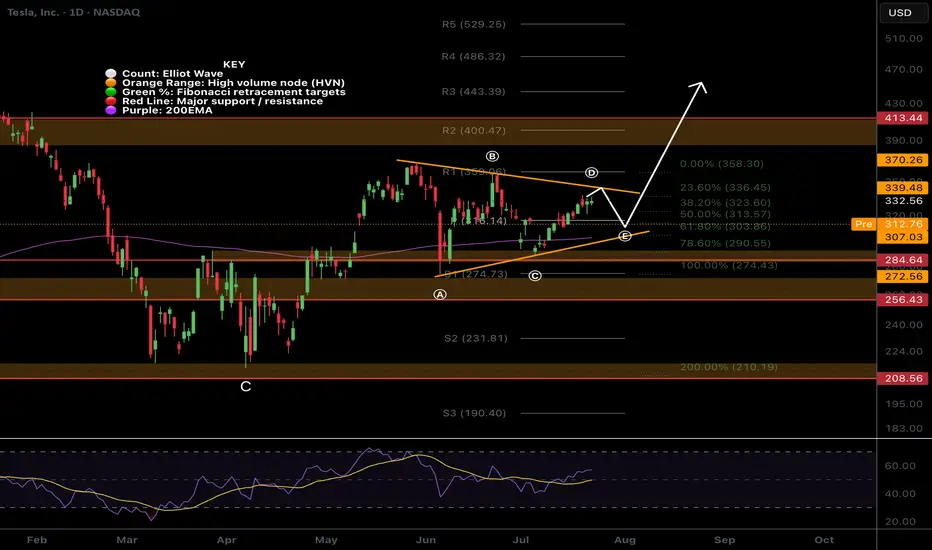
Wave e is expected to end at the daily pivot and wave d break is the signal to go long.
Analysis is invalidated below wave c.
PhD Candidate: Investing, Sentiment & Social Mood
MSc Financial Econ
Technical Analyst 7 years
Trader / Investor 14 years
DeTrended Metrics Report (Free): detrended.substack.com
Members Only Trading Signals: tradesignals.substack.com
MSc Financial Econ
Technical Analyst 7 years
Trader / Investor 14 years
DeTrended Metrics Report (Free): detrended.substack.com
Members Only Trading Signals: tradesignals.substack.com
คำจำกัดสิทธิ์ความรับผิดชอบ
ข้อมูลและบทความไม่ได้มีวัตถุประสงค์เพื่อก่อให้เกิดกิจกรรมทางการเงิน, การลงทุน, การซื้อขาย, ข้อเสนอแนะ หรือคำแนะนำประเภทอื่น ๆ ที่ให้หรือรับรองโดย TradingView อ่านเพิ่มเติมที่ ข้อกำหนดการใช้งาน