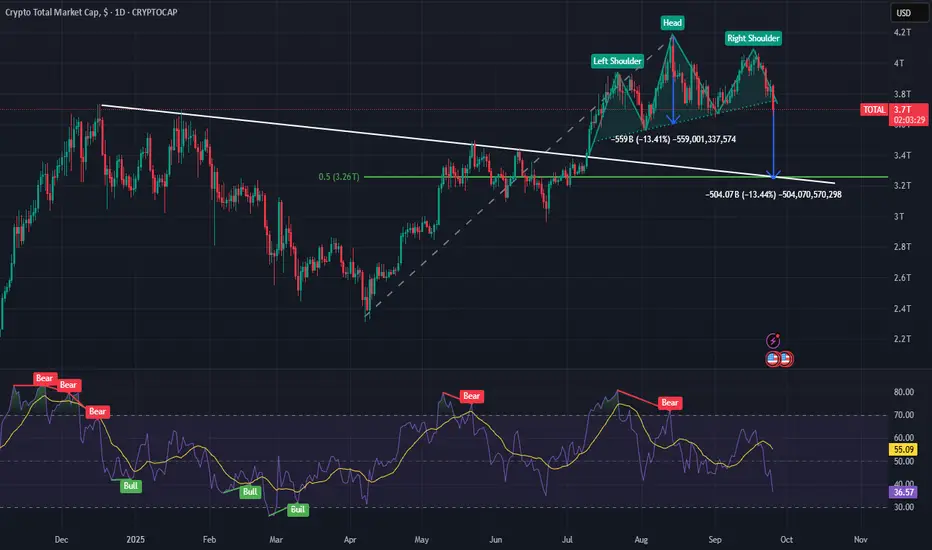
TOTAL chart appears to be forming a Head and Shoulders pattern, which typically signals a potential bearish reversal. Based on the recent high observed on 14 August 2025, the percentage decline from that peak to the neckline of the pattern is approximately 13.4%. If this pattern plays out as expected, it suggests a further downside of around 13.4%, equating to roughly $500 billion, which would bring TOTAL’s market cap down to approximately $3.26 trillion.
This target level is supported by two key technical confluences:
- A long-term trendline connecting major pivot highs dating back to 17 December 2024
- 50% Fibonacci retracement level, often considered a significant support zone
Given these factors, the probability of a continued decline appears high, and further downside pressure may be imminent.
คำจำกัดสิทธิ์ความรับผิดชอบ
ข้อมูลและบทความไม่ได้มีวัตถุประสงค์เพื่อก่อให้เกิดกิจกรรมทางการเงิน, การลงทุน, การซื้อขาย, ข้อเสนอแนะ หรือคำแนะนำประเภทอื่น ๆ ที่ให้หรือรับรองโดย TradingView อ่านเพิ่มเติมใน ข้อกำหนดการใช้งาน
คำจำกัดสิทธิ์ความรับผิดชอบ
ข้อมูลและบทความไม่ได้มีวัตถุประสงค์เพื่อก่อให้เกิดกิจกรรมทางการเงิน, การลงทุน, การซื้อขาย, ข้อเสนอแนะ หรือคำแนะนำประเภทอื่น ๆ ที่ให้หรือรับรองโดย TradingView อ่านเพิ่มเติมใน ข้อกำหนดการใช้งาน