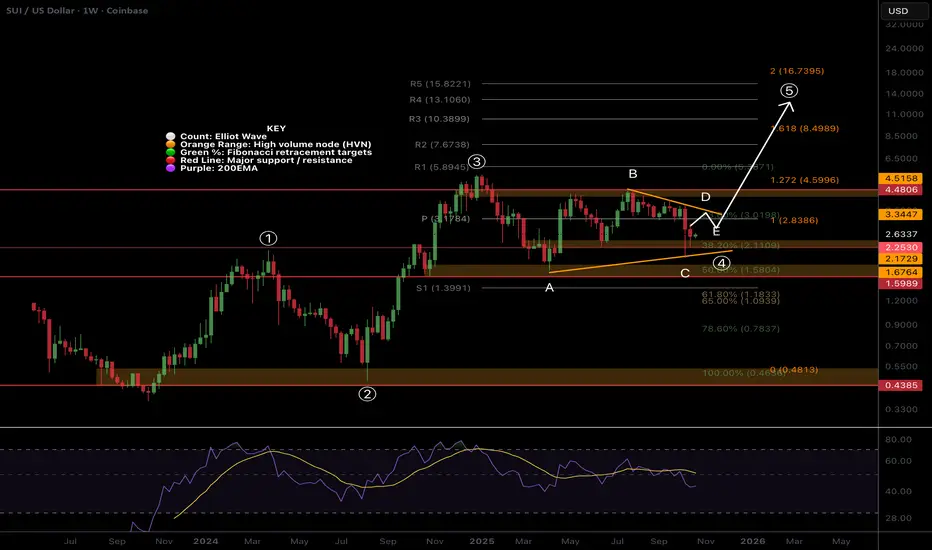
Wave (5) has a minimum target of the R5 weekly pivot at $15.8, at the 2 Fibonacci extension.
Falling below $1.7, wave A, invalidates the analysis and suggests we have much lower to go in a bear market.
Weekly RSI is bearish with lower to go but hidden bullish divergence has formed, a good raly will confirm.
SUI i holding up better than most with shallower retracements overall.
Safe trading
PhD Cand: Investing, Sentiment & Social Mood, MSc Financial Econ
Technical Analyst 8 years, Trader/Investor 15 years
Market Breakdown & Alpha Reports: detrended.substack.com
Earn & Learn Trade Planning & Signals (FREE WEEK): tradesignals.substack.com
Technical Analyst 8 years, Trader/Investor 15 years
Market Breakdown & Alpha Reports: detrended.substack.com
Earn & Learn Trade Planning & Signals (FREE WEEK): tradesignals.substack.com
การนำเสนอที่เกี่ยวข้อง
คำจำกัดสิทธิ์ความรับผิดชอบ
ข้อมูลและบทความไม่ได้มีวัตถุประสงค์เพื่อก่อให้เกิดกิจกรรมทางการเงิน, การลงทุน, การซื้อขาย, ข้อเสนอแนะ หรือคำแนะนำประเภทอื่น ๆ ที่ให้หรือรับรองโดย TradingView อ่านเพิ่มเติมที่ ข้อกำหนดการใช้งาน