are always important later. click the "add more candles" blue arrow
บันทึก
if it populates after publishing and provides oneบันทึก
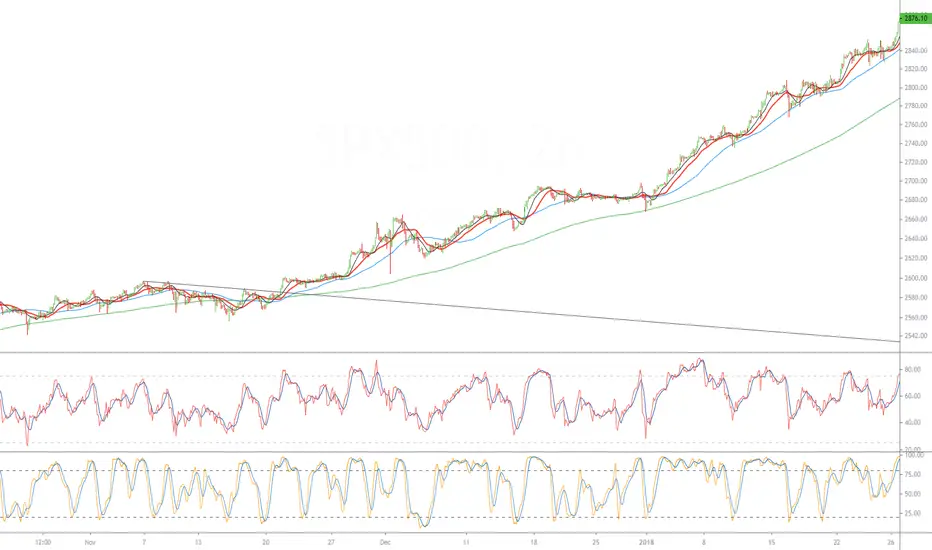
it didnt give me the blue arrow, but you can click and drag the chart to the left to show future candles and see the result. the point is to watch for these kinds of break outs (you can see how important that break out was by how far it went) and keep the line on your chart or be able to pick out the break out later and draw it in.บันทึก
and if you think that is crazy, extend the same line to christmas 2018.คำจำกัดสิทธิ์ความรับผิดชอบ
ข้อมูลและบทความไม่ได้มีวัตถุประสงค์เพื่อก่อให้เกิดกิจกรรมทางการเงิน, การลงทุน, การซื้อขาย, ข้อเสนอแนะ หรือคำแนะนำประเภทอื่น ๆ ที่ให้หรือรับรองโดย TradingView อ่านเพิ่มเติมใน ข้อกำหนดการใช้งาน
คำจำกัดสิทธิ์ความรับผิดชอบ
ข้อมูลและบทความไม่ได้มีวัตถุประสงค์เพื่อก่อให้เกิดกิจกรรมทางการเงิน, การลงทุน, การซื้อขาย, ข้อเสนอแนะ หรือคำแนะนำประเภทอื่น ๆ ที่ให้หรือรับรองโดย TradingView อ่านเพิ่มเติมใน ข้อกำหนดการใช้งาน