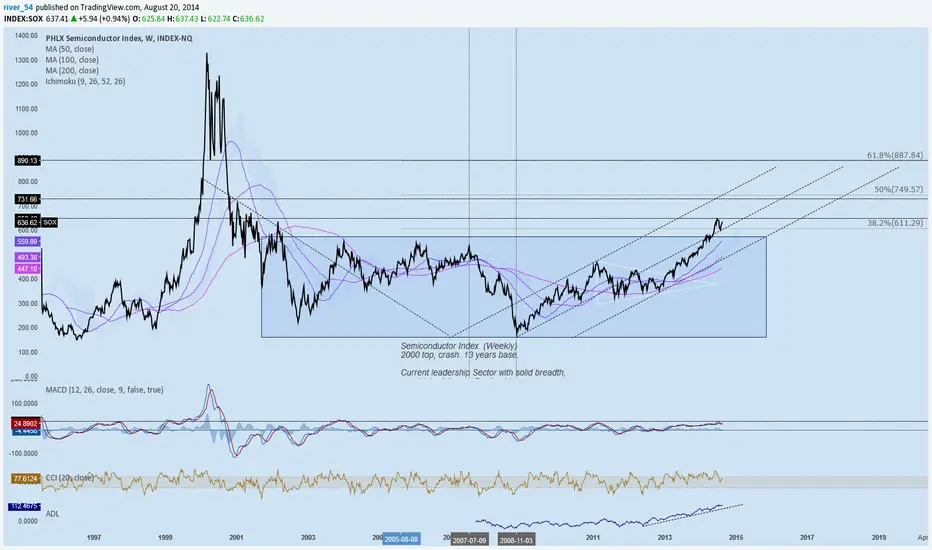
Semiconductor Index. (Weekly)
2000 top, crash. 12 to 13 years base.
Current leadership Sector with solid breadth,
new highs Advance Decline Line.
2000 high, 50% retracement at 750 level.
38.2% 611.
61.8% at 887.
trend_lines plotted.
2000 top, crash. 12 to 13 years base.
Current leadership Sector with solid breadth,
new highs Advance Decline Line.
2000 high, 50% retracement at 750 level.
38.2% 611.
61.8% at 887.
trend_lines plotted.
คำจำกัดสิทธิ์ความรับผิดชอบ
ข้อมูลและบทความไม่ได้มีวัตถุประสงค์เพื่อก่อให้เกิดกิจกรรมทางการเงิน, การลงทุน, การซื้อขาย, ข้อเสนอแนะ หรือคำแนะนำประเภทอื่น ๆ ที่ให้หรือรับรองโดย TradingView อ่านเพิ่มเติมใน ข้อกำหนดการใช้งาน
คำจำกัดสิทธิ์ความรับผิดชอบ
ข้อมูลและบทความไม่ได้มีวัตถุประสงค์เพื่อก่อให้เกิดกิจกรรมทางการเงิน, การลงทุน, การซื้อขาย, ข้อเสนอแนะ หรือคำแนะนำประเภทอื่น ๆ ที่ให้หรือรับรองโดย TradingView อ่านเพิ่มเติมใน ข้อกำหนดการใช้งาน