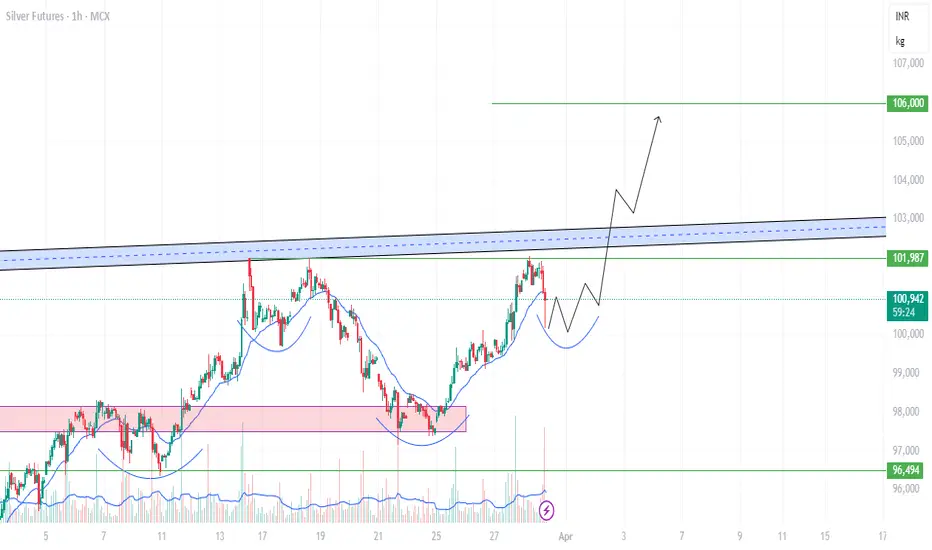
chart shows an Inverse Head and Shoulders pattern in Silver Futures on the 1-hour timeframe.
The neckline (resistance) is marked by the blue zone, which, if broken with strong volume, could confirm a bullish breakout. The projected price movement (black arrow) suggests a potential rally toward ₹106,000.
A confirmation would come if the price breaks above the ₹101,987 - ₹103,000 resistance zone with volume.
Place SL below the right shoulder (~₹100,000) for a safe trade.
คำจำกัดสิทธิ์ความรับผิดชอบ
ข้อมูลและบทความไม่ได้มีวัตถุประสงค์เพื่อก่อให้เกิดกิจกรรมทางการเงิน, การลงทุน, การซื้อขาย, ข้อเสนอแนะ หรือคำแนะนำประเภทอื่น ๆ ที่ให้หรือรับรองโดย TradingView อ่านเพิ่มเติมที่ ข้อกำหนดการใช้งาน
คำจำกัดสิทธิ์ความรับผิดชอบ
ข้อมูลและบทความไม่ได้มีวัตถุประสงค์เพื่อก่อให้เกิดกิจกรรมทางการเงิน, การลงทุน, การซื้อขาย, ข้อเสนอแนะ หรือคำแนะนำประเภทอื่น ๆ ที่ให้หรือรับรองโดย TradingView อ่านเพิ่มเติมที่ ข้อกำหนดการใช้งาน