I have seldom written about one of my favorite stocks within the retails sector.  SFM has been a great momentum stock but on Aug 12th I highlighted that the stock is loosing momentum.
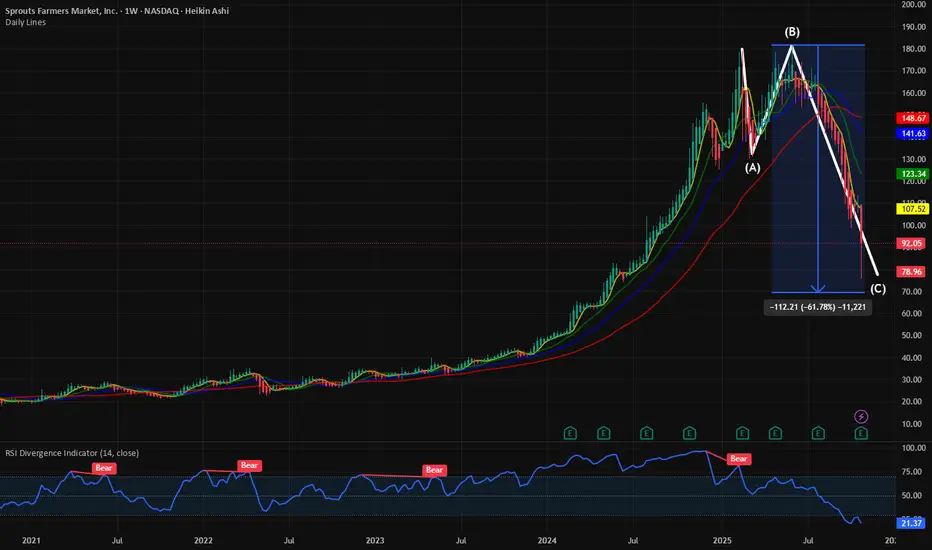
SFM vs XRT: SFM losses momentum. Underperforming XRT. for NASDAQ:SFM by RabishankarBiswal — TradingView
Since my last blog when the RSI was above 40, the stock has lost 50% of the value. Crrently the RSI is @ 20 and forming a double bottom on the charts. With such heavy correction on such a momentum stock it makes sense to look at the Eliot correction wave. Usually the 3rd wave is the longest in such corrective patterns. With the stock hovering around 75 $ it has almost corrected 60 %. The 0.618 Fib retracement level from the 52 week high is at 70 $.SFM has usually outperformed the  XRT and SPY over the last 5 years and still holding its outperformance.
Trade set up :SFM is in an accumulation pattern. Eliot correction pattern is nearing completion. Stock to bottom @ 70 $. Double bottom in RSI is bullish.
Since my last blog when the RSI was above 40, the stock has lost 50% of the value. Crrently the RSI is @ 20 and forming a double bottom on the charts. With such heavy correction on such a momentum stock it makes sense to look at the Eliot correction wave. Usually the 3rd wave is the longest in such corrective patterns. With the stock hovering around 75 $ it has almost corrected 60 %. The 0.618 Fib retracement level from the 52 week high is at 70 $.
Trade set up :
การนำเสนอที่เกี่ยวข้อง
คำจำกัดสิทธิ์ความรับผิดชอบ
ข้อมูลและบทความไม่ได้มีวัตถุประสงค์เพื่อก่อให้เกิดกิจกรรมทางการเงิน, การลงทุน, การซื้อขาย, ข้อเสนอแนะ หรือคำแนะนำประเภทอื่น ๆ ที่ให้หรือรับรองโดย TradingView อ่านเพิ่มเติมที่ ข้อกำหนดการใช้งาน
การนำเสนอที่เกี่ยวข้อง
คำจำกัดสิทธิ์ความรับผิดชอบ
ข้อมูลและบทความไม่ได้มีวัตถุประสงค์เพื่อก่อให้เกิดกิจกรรมทางการเงิน, การลงทุน, การซื้อขาย, ข้อเสนอแนะ หรือคำแนะนำประเภทอื่น ๆ ที่ให้หรือรับรองโดย TradingView อ่านเพิ่มเติมที่ ข้อกำหนดการใช้งาน