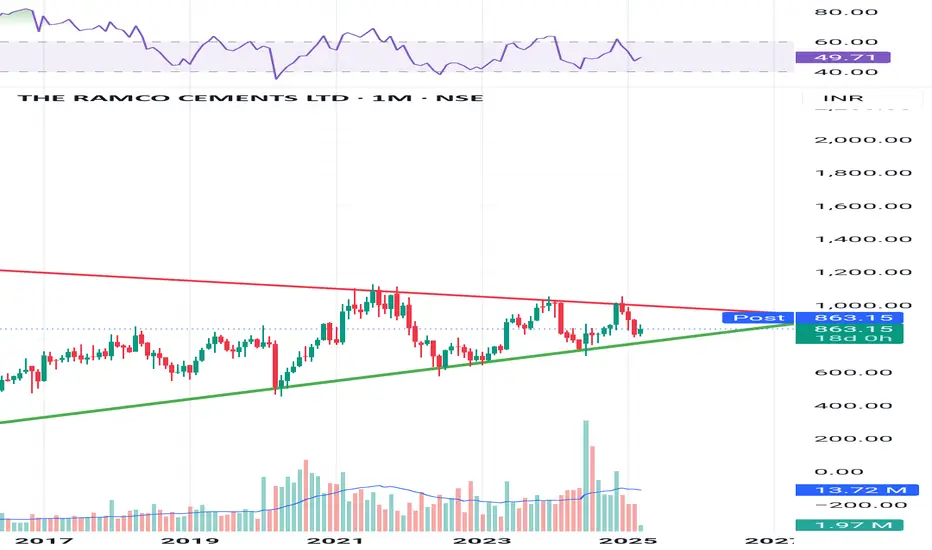
This chart shows The Ramco Cements Ltd on a monthly timeframe, with price action forming a clear structure.
Analysis:
Pattern: A symmetrical triangle pattern, where the price is trading within a narrowing range.
Resistance (Red Line): Around ₹1000, where the price has faced multiple rejections.
Support (Green Line): Higher lows, indicating that the long-term uptrend is still intact.
RSI: Currently around 49.71, sitting in a neutral zone — neither overbought nor oversold.
Deception Point:
If the price breaks below ₹800 and sustains, it could signal a bearish breakdown.
Conversely, a breakout above ₹1000 with volume confirmation could trigger a strong bullish rally.
Next Steps:
Wait for a breakout with volume to confirm the move.
Enter the trade only after a confirmation candle to avoid getting trapped in a false breakout.
คำจำกัดสิทธิ์ความรับผิดชอบ
ข้อมูลและบทความไม่ได้มีวัตถุประสงค์เพื่อก่อให้เกิดกิจกรรมทางการเงิน, การลงทุน, การซื้อขาย, ข้อเสนอแนะ หรือคำแนะนำประเภทอื่น ๆ ที่ให้หรือรับรองโดย TradingView อ่านเพิ่มเติมที่ ข้อกำหนดการใช้งาน
คำจำกัดสิทธิ์ความรับผิดชอบ
ข้อมูลและบทความไม่ได้มีวัตถุประสงค์เพื่อก่อให้เกิดกิจกรรมทางการเงิน, การลงทุน, การซื้อขาย, ข้อเสนอแนะ หรือคำแนะนำประเภทอื่น ๆ ที่ให้หรือรับรองโดย TradingView อ่านเพิ่มเติมที่ ข้อกำหนดการใช้งาน