📊 QQQ Technical Outlook – Symmetrical Triangle After Pullback
Ticker: QQQ (Invesco Nasdaq-100 ETF)
Timeframe: 30-minute candles
🔍 Current Setup
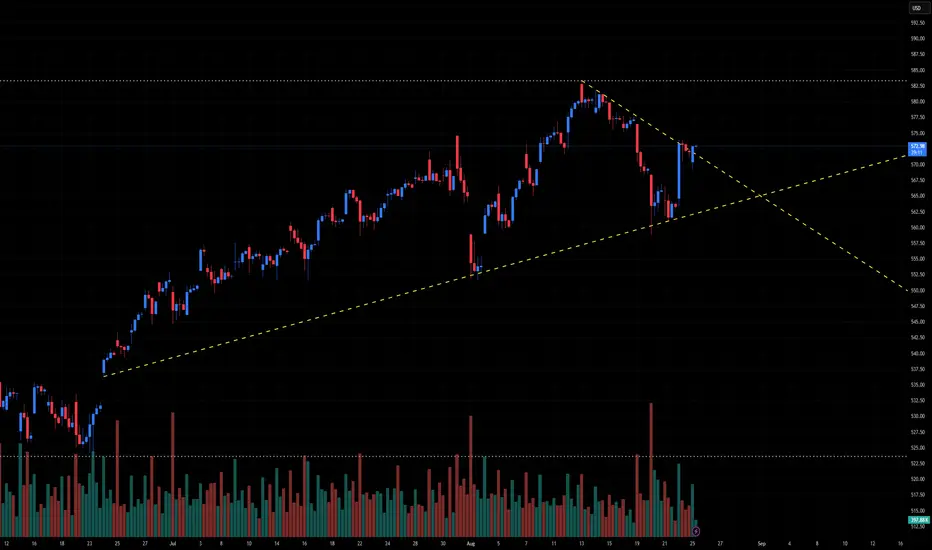
QQQ has been in a strong uptrend since June, peaking around ~582 before pulling back. Price is now consolidating into a symmetrical triangle, with:
Descending resistance: from ~582 down toward current ~572.
Ascending support: from June lows, now near 563–565.
Current price: ~572, sitting right near the apex.
This structure suggests compression ahead of a breakout move.
📊 Breakout Levels
🚀 Upside (Bullish Scenario)
Trigger: Break and close above 575–577.
Intermediate Targets:
582–585 → Prior highs.
590 → Extension zone.
Measured Move Target: ~600 (triangle height projection).
🔻 Downside (Bearish Scenario)
Trigger: Break below 565, with confirmation under 563.
Intermediate Supports:
555–552 → First demand zone.
540–542 → Stronger support.
Measured Move Target: ~545 (triangle height projection downward).
📈 Volume Analysis
Volume has contracted during this triangle — classic consolidation behavior.
Expect a volume expansion to confirm the breakout direction.
⚖️ Probability Bias
The trend into the pattern was bullish, favoring continuation higher.
Still, failure to defend 565 could quickly open downside risk toward 552–545.
✅ Takeaway
QQQ is at a major decision point inside a symmetrical triangle:
Bullish Break > 577: Targets 582 → 590 → 600
Bearish Break < 565: Targets 555 → 545
Ticker: QQQ (Invesco Nasdaq-100 ETF)
Timeframe: 30-minute candles
🔍 Current Setup
QQQ has been in a strong uptrend since June, peaking around ~582 before pulling back. Price is now consolidating into a symmetrical triangle, with:
Descending resistance: from ~582 down toward current ~572.
Ascending support: from June lows, now near 563–565.
Current price: ~572, sitting right near the apex.
This structure suggests compression ahead of a breakout move.
📊 Breakout Levels
🚀 Upside (Bullish Scenario)
Trigger: Break and close above 575–577.
Intermediate Targets:
582–585 → Prior highs.
590 → Extension zone.
Measured Move Target: ~600 (triangle height projection).
🔻 Downside (Bearish Scenario)
Trigger: Break below 565, with confirmation under 563.
Intermediate Supports:
555–552 → First demand zone.
540–542 → Stronger support.
Measured Move Target: ~545 (triangle height projection downward).
📈 Volume Analysis
Volume has contracted during this triangle — classic consolidation behavior.
Expect a volume expansion to confirm the breakout direction.
⚖️ Probability Bias
The trend into the pattern was bullish, favoring continuation higher.
Still, failure to defend 565 could quickly open downside risk toward 552–545.
✅ Takeaway
QQQ is at a major decision point inside a symmetrical triangle:
Bullish Break > 577: Targets 582 → 590 → 600
Bearish Break < 565: Targets 555 → 545
คำจำกัดสิทธิ์ความรับผิดชอบ
ข้อมูลและบทความไม่ได้มีวัตถุประสงค์เพื่อก่อให้เกิดกิจกรรมทางการเงิน, การลงทุน, การซื้อขาย, ข้อเสนอแนะ หรือคำแนะนำประเภทอื่น ๆ ที่ให้หรือรับรองโดย TradingView อ่านเพิ่มเติมที่ ข้อกำหนดการใช้งาน
คำจำกัดสิทธิ์ความรับผิดชอบ
ข้อมูลและบทความไม่ได้มีวัตถุประสงค์เพื่อก่อให้เกิดกิจกรรมทางการเงิน, การลงทุน, การซื้อขาย, ข้อเสนอแนะ หรือคำแนะนำประเภทอื่น ๆ ที่ให้หรือรับรองโดย TradingView อ่านเพิ่มเติมที่ ข้อกำหนดการใช้งาน