Occidental Petroleum's bearish setup points to near-term weaknes
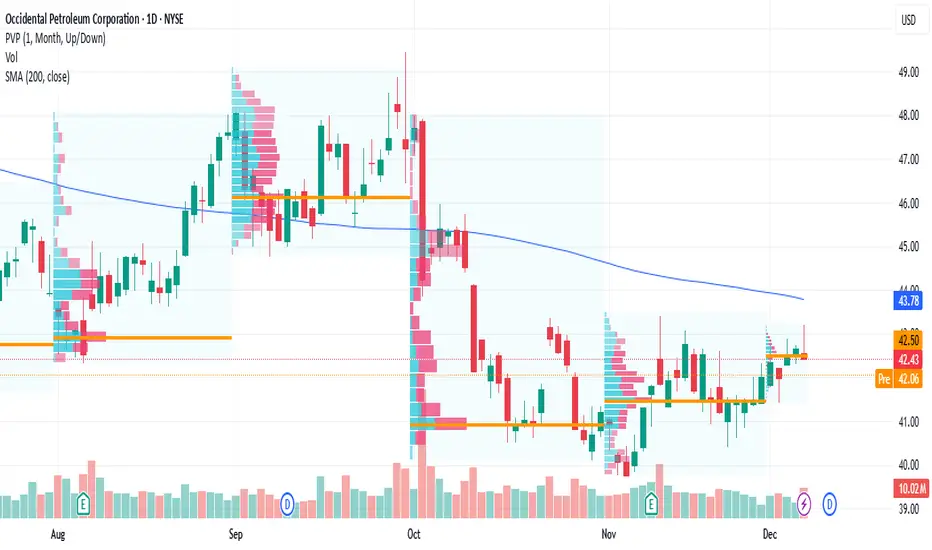
Current Price: $42.43
Direction: SHORT
Confidence Level: 62% (Based on trader consensus leaning bearish, mixed but cautious X sentiment, and recent inability to break key resistance)
Targets:
- T1 = $41.60
- T2 = $40.80
Stop Levels:
- S1 = $43.40
- S2 = $44.20
**Wisdom of Professional Traders:**
Several professional traders are indicating a bearish leaning for Occidental Petroleum this week. The collective trader consensus highlights weak cash flow at current oil prices, recent asset divestments, and resistance around the $44 level as key factors limiting upside. By pooling these perspectives, it's clear the trading community sees the balance of risk tilted to the downside in the short term.
**Key Insights:**
Here's what's driving this call: most trader analyses are focusing on how Occidental's recent earnings miss (net income down over 25% YoY) weakened sentiment, and multiple hedge funds have trimmed positions. The trading crowd is pointing out that oil remains under pressure and Occidental needs prices above $45/barrel to comfortably sustain dividends. Recent asset sales to Berkshire Hathaway are seen as long-term strategic moves but not an immediate earnings driver.
What's also interesting is that X sentiment, while containing bullish voices, has a slightly higher proportion of bearish posts calling for caution. That mix shows traders are getting defensive rather than chasing upside. With price failing to hold above $44 multiple times in recent weeks, resistance is proving stubborn.
**Recent Performance:**
Over the past week, OXY has slipped 1.59% and struggled to maintain gains despite a 2.12% monthly rise. It tested the $43.20 zone but quickly reversed, showing sellers stepping in near resistance. The stock is also down roughly 17% over the past year, pointing to a broader weak trend that hasn’t materially reversed since early fall.
**Expert Analysis:**
Multiple professional traders I track have identified $44 as critical resistance. They see the repeated failures there as a sign that short-term momentum is fading. Chart-wise, the support area around $41 has been tested but not convincingly broken yet — the main call is that if $41 gives way, $40 becomes the next natural target. Fundamentals add weight: revenue dropped nearly 8% year-on-year, and operating expenses have ticked up.
On the flip side, those bullish argue company debt reduction and renewable energy investments could pay off longer term, but they admit short-term risk is elevated.
**News Impact:**
Recent headlines about large institutional shareholders cutting positions reinforce bearish sentiment. The asset sale to Berkshire Hathaway was well-received strategically, but for traders looking at the next week, reduced positions from Fisher Asset Management and Mirabella send a cautionary signal. Morgan Stanley's price target cut to $51 adds to the cautious tone, even if the long-term fair value remains higher.
**Trading Recommendation:**
Here's my take: the setup favors a short move from current levels, aiming for $41.60 this week and $40.80 if momentum accelerates. Resistance at $43.40 and $44.20 are key stop zones to manage risk. Position sizing should be modest given mixed social sentiment but lean into the professional trader consensus on short bias. If $41 breaks, be ready for a quick run towards $40.
คำจำกัดสิทธิ์ความรับผิดชอบ
ข้อมูลและบทความไม่ได้มีวัตถุประสงค์เพื่อก่อให้เกิดกิจกรรมทางการเงิน, การลงทุน, การซื้อขาย, ข้อเสนอแนะ หรือคำแนะนำประเภทอื่น ๆ ที่ให้หรือรับรองโดย TradingView อ่านเพิ่มเติมใน ข้อกำหนดการใช้งาน
คำจำกัดสิทธิ์ความรับผิดชอบ
ข้อมูลและบทความไม่ได้มีวัตถุประสงค์เพื่อก่อให้เกิดกิจกรรมทางการเงิน, การลงทุน, การซื้อขาย, ข้อเสนอแนะ หรือคำแนะนำประเภทอื่น ๆ ที่ให้หรือรับรองโดย TradingView อ่านเพิ่มเติมใน ข้อกำหนดการใช้งาน