Hello Traders,
Today we will have a look at NASDAQ in the 1-hour timeframe.
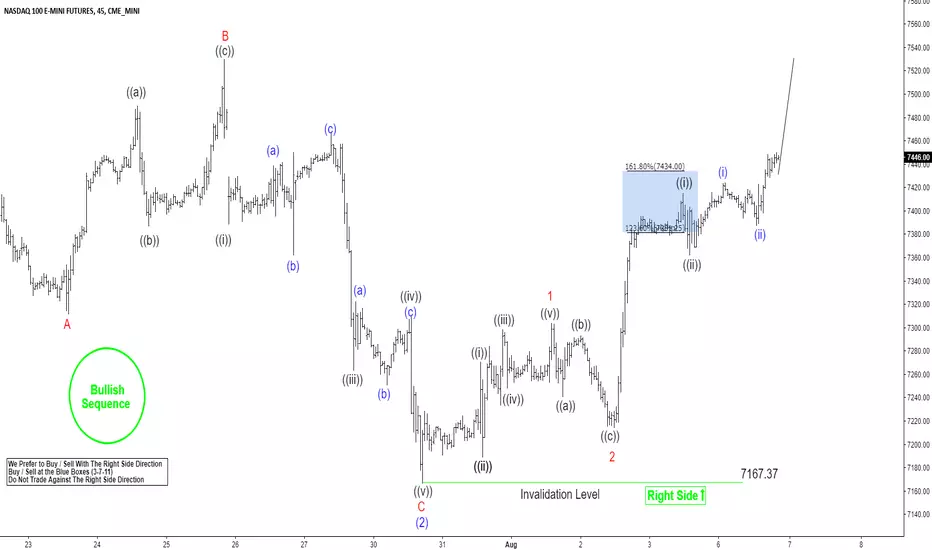
Short-term Elliott wave analysis suggests that the decline to $7167.37 low ended blue wave (2) pullback. The internals of that pullback unfolded as Elliott Wave Flat correction where red wave A ended at $7311.50 low. Above from there, the bounce to $7530 high ended red wave B bounce as Elliott wave Zigzag where black wave ((a)) ended at $7489.75 high, black wave ((b)) pullback ended at $7386.75 low and black wave ((c)) of red B ended at $7530 high.
Down from there, the index declined in 5 waves lower within red wave C. The first leg lower black wave ((i)) ended at $7388.5. Up from there, the bounce to $7467 high ended black wave ((ii)) and then the decline to $7263.50 low ended black wave ((iii)). black wave ((iv)) bounce ended at $7309.25 and the last leg black wave ((v)) of red C ended at $7167.37 low. This last leg also completed blue wave (2) pullback.
Near-term, while dips remain above $7167.37 low, we expect the Index to resume the next leg higher. A break above $7530 (irregular red wave B) however is needed for final confirmation to avoid a double correction lower. As long as the pivot at 7167.37 low in our distribution system stays intact, we expect it move higher. We don’t like selling the index.
Today we will have a look at NASDAQ in the 1-hour timeframe.
Short-term Elliott wave analysis suggests that the decline to $7167.37 low ended blue wave (2) pullback. The internals of that pullback unfolded as Elliott Wave Flat correction where red wave A ended at $7311.50 low. Above from there, the bounce to $7530 high ended red wave B bounce as Elliott wave Zigzag where black wave ((a)) ended at $7489.75 high, black wave ((b)) pullback ended at $7386.75 low and black wave ((c)) of red B ended at $7530 high.
Down from there, the index declined in 5 waves lower within red wave C. The first leg lower black wave ((i)) ended at $7388.5. Up from there, the bounce to $7467 high ended black wave ((ii)) and then the decline to $7263.50 low ended black wave ((iii)). black wave ((iv)) bounce ended at $7309.25 and the last leg black wave ((v)) of red C ended at $7167.37 low. This last leg also completed blue wave (2) pullback.
Near-term, while dips remain above $7167.37 low, we expect the Index to resume the next leg higher. A break above $7530 (irregular red wave B) however is needed for final confirmation to avoid a double correction lower. As long as the pivot at 7167.37 low in our distribution system stays intact, we expect it move higher. We don’t like selling the index.
14 days trial --> elliottwave-forecast.com/plan-trial/ and get Accurate & timely Elliott Wave Forecasts of 78 instruments. Webinars, Chat Room, Stocks/Forex/Indices Signals & more.
คำจำกัดสิทธิ์ความรับผิดชอบ
ข้อมูลและบทความไม่ได้มีวัตถุประสงค์เพื่อก่อให้เกิดกิจกรรมทางการเงิน, การลงทุน, การซื้อขาย, ข้อเสนอแนะ หรือคำแนะนำประเภทอื่น ๆ ที่ให้หรือรับรองโดย TradingView อ่านเพิ่มเติมที่ ข้อกำหนดการใช้งาน