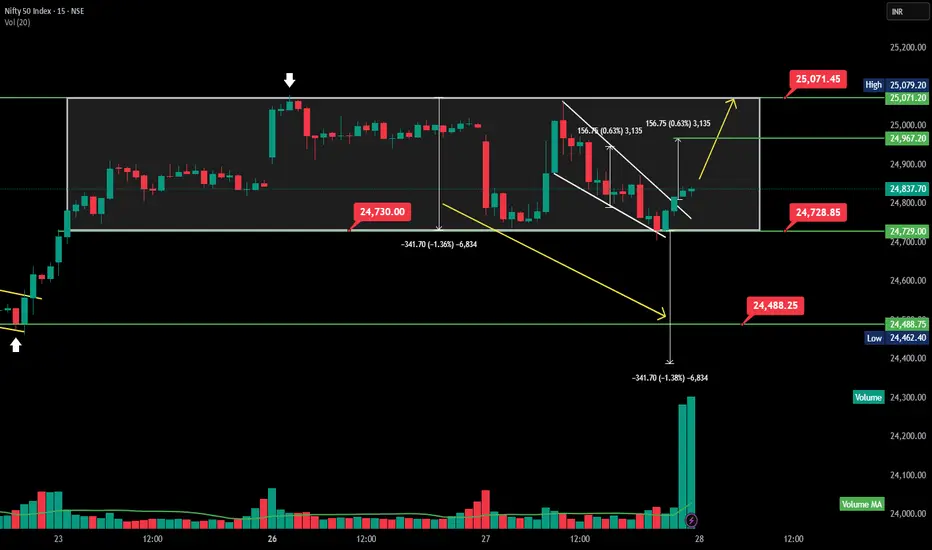
This is a **15-min intraday chart of Nifty 50 Index**, showing a **channel and retest**, followed by a potential **pullback setup** within a rectangle consolidation range.
---
### 📊 **Nifty 50 – Intraday Breakdown & Range Play Analysis**
#### 🔍 Chart Breakdown:
* **Range-bound Movement** between:
📌 Resistance: **25,071.45**
📌 Support: **24,730.00**
* **Breakdown from Rectangle:** Price fell sharply from range top to bottom, testing support at **24,730.00**.
* ** Flag Formation:** After the drop, price formed a flag pattern and gave break out for target - 24967.
* **Measured Move Target:**
Height of rectangle range = \~**342 pts**
📉 Breakdown target: **\~24,488**
📈 Rebound target (if breakout sustains) test top resistance: **\~25,071**
#### 🔄 **Scenario Outlook:**
* 🔼 **Bullish : can test 24,967 for move towards **25,071**
* 🔽 **Bearish below:** 24,728 — breakdown confirmation towards **24,488**
#### 📈 Volume Spike:
* Recent big green volume candle suggests accumulation or short covering.
---
Would you like a YouTube post setup for this intraday chart too?
---
### 📊 **Nifty 50 – Intraday Breakdown & Range Play Analysis**
#### 🔍 Chart Breakdown:
* **Range-bound Movement** between:
📌 Resistance: **25,071.45**
📌 Support: **24,730.00**
* **Breakdown from Rectangle:** Price fell sharply from range top to bottom, testing support at **24,730.00**.
* ** Flag Formation:** After the drop, price formed a flag pattern and gave break out for target - 24967.
* **Measured Move Target:**
Height of rectangle range = \~**342 pts**
📉 Breakdown target: **\~24,488**
📈 Rebound target (if breakout sustains) test top resistance: **\~25,071**
#### 🔄 **Scenario Outlook:**
* 🔼 **Bullish : can test 24,967 for move towards **25,071**
* 🔽 **Bearish below:** 24,728 — breakdown confirmation towards **24,488**
#### 📈 Volume Spike:
* Recent big green volume candle suggests accumulation or short covering.
---
Would you like a YouTube post setup for this intraday chart too?
คำจำกัดสิทธิ์ความรับผิดชอบ
ข้อมูลและบทความไม่ได้มีวัตถุประสงค์เพื่อก่อให้เกิดกิจกรรมทางการเงิน, การลงทุน, การซื้อขาย, ข้อเสนอแนะ หรือคำแนะนำประเภทอื่น ๆ ที่ให้หรือรับรองโดย TradingView อ่านเพิ่มเติมใน ข้อกำหนดการใช้งาน
คำจำกัดสิทธิ์ความรับผิดชอบ
ข้อมูลและบทความไม่ได้มีวัตถุประสงค์เพื่อก่อให้เกิดกิจกรรมทางการเงิน, การลงทุน, การซื้อขาย, ข้อเสนอแนะ หรือคำแนะนำประเภทอื่น ๆ ที่ให้หรือรับรองโดย TradingView อ่านเพิ่มเติมใน ข้อกำหนดการใช้งาน