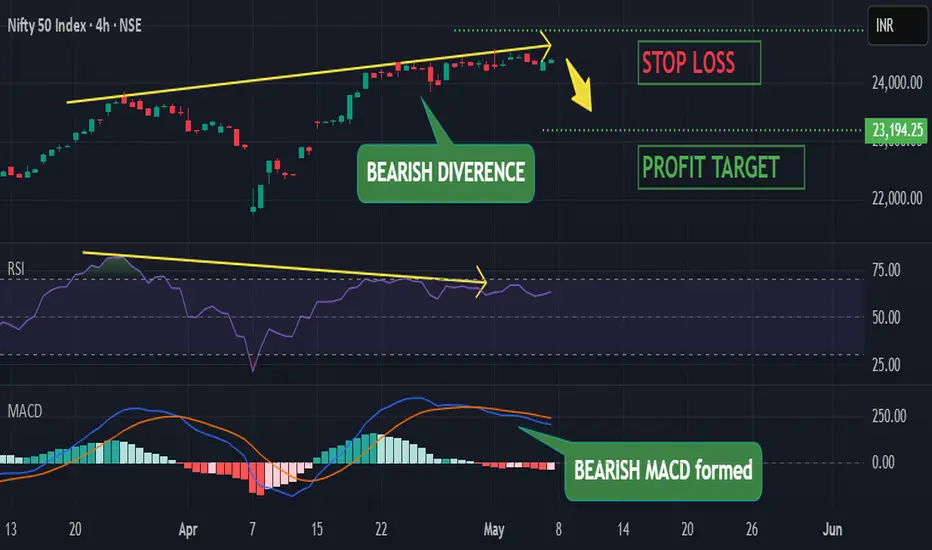
- BEARISH DIVERGENCE -
Market has formed a higher high on the chart whereas rsi has formed a lower high which indicates a bearish divergence pattern. This indicates upcoming market fall
Bearish Divergence forms when market forms higher high & rsi forms lower high - BEARISH MACD -
The macd line recently crossed below the signal line inside the macd indicator forming bearish macd crossover. Market is likely to fall in the upcoming days due to this bearish signal
MACD indicator is the combination of 2 lines - macd line is the difference between 26-period & 12-peroid EMA & signal line is the 9-period EMA of macd line - INVERTED HAMMER CANDLESTICK -
On daily timeframe NIFTY has formed a bearish candlestick pattern called "Inverted Hammer". it indicates reversal of the ongoing trend and beginning of the opposite trend ie bearish trend here.
Inverted Hammer candlestick is formed when a candlestick has long upper shadow & smaller body at the bottom - PROFIT TARGET -
target is 23194.25 - STOP LOSS -
24908.05
My Social Media links :
📥 Instagram - instagram.com/sagar_trademaster/
📥 Youtube - youtube.com/@TruthfulTrader
📥 Instagram - instagram.com/sagar_trademaster/
📥 Youtube - youtube.com/@TruthfulTrader
คำจำกัดสิทธิ์ความรับผิดชอบ
ข้อมูลและบทความไม่ได้มีวัตถุประสงค์เพื่อก่อให้เกิดกิจกรรมทางการเงิน, การลงทุน, การซื้อขาย, ข้อเสนอแนะ หรือคำแนะนำประเภทอื่น ๆ ที่ให้หรือรับรองโดย TradingView อ่านเพิ่มเติมที่ ข้อกำหนดการใช้งาน