🔹 Intro / Overview
Fibonacci retracement highlights potential support and resistance zones during pullbacks. By mapping ratios between swing highs and lows, traders can structure trades, plan entries, and manage risk — not predict the market.
📖 How to Use
1️⃣ Identify Swing Points – Draw from recent swing low ➝ swing high (or reverse for downtrend)
2️⃣ Watch Key Levels – 23.6%, 38.2%, 50%, 61.8%, 78.6%
3️⃣ Confirm with Price Action – Candle closes above/below key levels = stronger signal
4️⃣ Plan Stops & Targets – Use Fibonacci zones or swing points
5️⃣ Enhance Reliability – Combine with trendlines, moving averages, or candlestick patterns
📊 Chart Explanation (Step-by-Step)
The chart demonstrates a possible long setup using Fibonacci retracement:
🔍 Observations
📌 Trade Management
✨ Key Takeaways
✔ Fibonacci is a guide, not a prediction
✔ Candle closes near levels strengthen entries
✔ Stops & targets can flex with Fibonacci or swing structure
✔ Always use confluence for decision-making
✅ Conclusion
Fibonacci retracement is a visual framework to time entries and exits with discipline. Combine it with other tools for stronger setups.
⚠️ Disclaimer: For educational purposes only. Not financial advice.
Fibonacci retracement highlights potential support and resistance zones during pullbacks. By mapping ratios between swing highs and lows, traders can structure trades, plan entries, and manage risk — not predict the market.
📖 How to Use
1️⃣ Identify Swing Points – Draw from recent swing low ➝ swing high (or reverse for downtrend)
2️⃣ Watch Key Levels – 23.6%, 38.2%, 50%, 61.8%, 78.6%
3️⃣ Confirm with Price Action – Candle closes above/below key levels = stronger signal
4️⃣ Plan Stops & Targets – Use Fibonacci zones or swing points
5️⃣ Enhance Reliability – Combine with trendlines, moving averages, or candlestick patterns
📊 Chart Explanation (Step-by-Step)
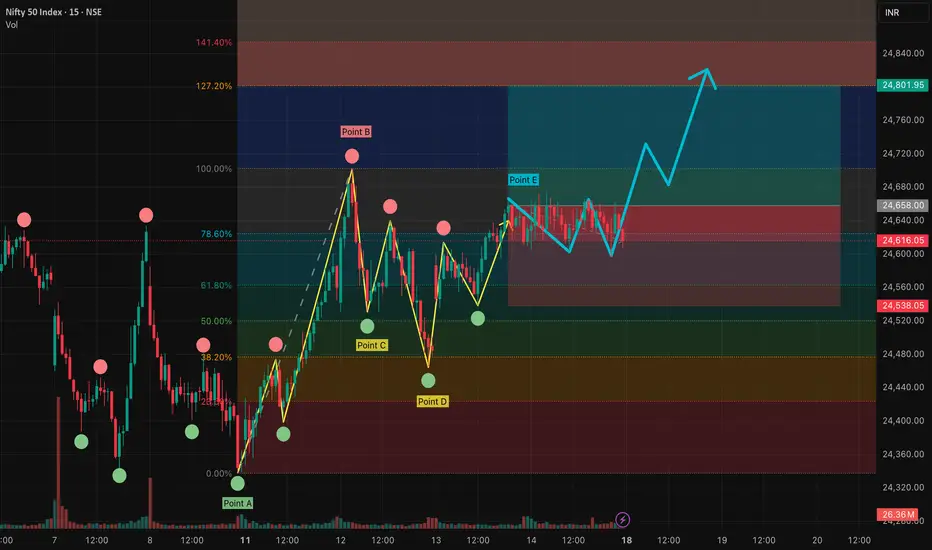
The chart demonstrates a possible long setup using Fibonacci retracement:
- Point A (Swing Low): Starting point of the retracement
- Point B (Swing High): Endpoint establishing Fibonacci ratios
- Point C (Chart Confirmation): Swing low confirming levels are relevant
- Point D (Potential Invalidation): Price dips near 38.2%–61.8%; closes below could invalidate
- Point E (Entry Zone): Successive closes above 78.6% confirm entry
🔍 Observations
- Price respected multiple Fibonacci zones (38.2%, 50%, 61.8%)
- Swing highs/lows defined the structure
- Yellow path = past trend movement
- Blue path = potential reaction for illustration only
📌 Trade Management
- Stops: Just beyond Fibonacci zones or swing points
- Targets: Next Fibonacci level or previous swing high/low
- Reliability increases when combined with other confirmations
✨ Key Takeaways
✔ Fibonacci is a guide, not a prediction
✔ Candle closes near levels strengthen entries
✔ Stops & targets can flex with Fibonacci or swing structure
✔ Always use confluence for decision-making
✅ Conclusion
Fibonacci retracement is a visual framework to time entries and exits with discipline. Combine it with other tools for stronger setups.
⚠️ Disclaimer: For educational purposes only. Not financial advice.
บันทึก
✅ As projected, the price respected the Fibonacci Retracement levels and moved in the same direction we highlighted.📊 This illustrates the effectiveness of Fibonacci in identifying potential reaction zones.
💡 A useful reminder that when combined with discipline, technical levels can offer powerful learning insights.
บันทึก
Update (22 Aug): After price reached the 200% Fibonacci extension, the trend shifted to bearish on closing below the 150% level. This highlights how the Fibonacci levels have worked so far for projection and trailing-stop purposes.
We now wait for a proper bearish confirmation before applying bearish Fibonacci zones.
คำจำกัดสิทธิ์ความรับผิดชอบ
ข้อมูลและบทความไม่ได้มีวัตถุประสงค์เพื่อก่อให้เกิดกิจกรรมทางการเงิน, การลงทุน, การซื้อขาย, ข้อเสนอแนะ หรือคำแนะนำประเภทอื่น ๆ ที่ให้หรือรับรองโดย TradingView อ่านเพิ่มเติมที่ ข้อกำหนดการใช้งาน
คำจำกัดสิทธิ์ความรับผิดชอบ
ข้อมูลและบทความไม่ได้มีวัตถุประสงค์เพื่อก่อให้เกิดกิจกรรมทางการเงิน, การลงทุน, การซื้อขาย, ข้อเสนอแนะ หรือคำแนะนำประเภทอื่น ๆ ที่ให้หรือรับรองโดย TradingView อ่านเพิ่มเติมที่ ข้อกำหนดการใช้งาน