The US 100 registered its first down week of September when it closed at 24507 last Friday, a weekly loss of 0.4%. Hardly a collapse but a warning that no market moves in a straight line, especially one so sensitive to many of the key drivers that traders are focused on, namely AI and Federal Reserve (Fed) interest rate moves.
It seems that last week’s dip may have been driven by some profit taking into the end of what has been a strong third quarter performance for this technology heavy index (8%, July 1st to September 26th). That drop has already been unwound by yesterday’s 0.4% rally which has continued this morning to current levels around 24640 (0730 BST), as traders’ position for some key economic data on the US labour market, which could clear up whether the Fed has room to cut interest rates again when they meet next on October 29th.
While there is a US labour market data release scheduled for every day across the remainder of this week, the focus could be Friday’s Payrolls update, where traders are anticipating a modest gain of around 39k and the unemployment rate to remain at its current level of 4.3%. Any deviation from these expectations could impact the market’s pricing of around a 90% chance of an October Fed rate cut, and a 60% chance of another December rate cut, with knock on implications for the direction of the US 100 at the start of Q4.
One obstacle impacting Friday’s Payrolls could be the possibility for a US Federal government shutdown from October 1st, which could delay the release of the labour market data, creating an extra level of uncertainty into the end of the week. Congressional leaders met with President Trump at the White House yesterday and talks to avoid a shutdown are on-going, although the latest updates provided by Vice President Vance suggests that a funding agreement is still some way off.
It may be worthwhile monitoring progress on this throughout the day ahead, just in case an agreement isn’t reached, and it leads to some extra US 100 volatility.
Technical Update: Price Decline Finding Support
Price corrections are a natural part of a broader uptrend and often reflect a healthy reaction to recent upside extremes. Following last week’s sell-off in the US 100 index, traders may now be assessing whether the latest weakness is simply a limited pullback ahead of renewed attempts to extend what still appears to be a constructive trend, or the beginning of a more extended price decline.

While it’s impossible to confirm whether a renewed phase of strength is underway, last week’s initial weakness found support at lower levels. As the chart above shows, fresh upside attempts may now be emerging, suggesting the possibility of a resumption of the uptrend pattern.
While positive sentiment may still be evident, this week’s upcoming data releases could prove pivotal, with the potential to shift momentum and drive notable price moves across key assets and traders will be watching closely for confirmation, or disruption, of the current US 100 index trend.
As a result, it may be important to identify and then monitor key support and resistance levels in case an increased spell of volatility emerges.
Potential Support Levels:
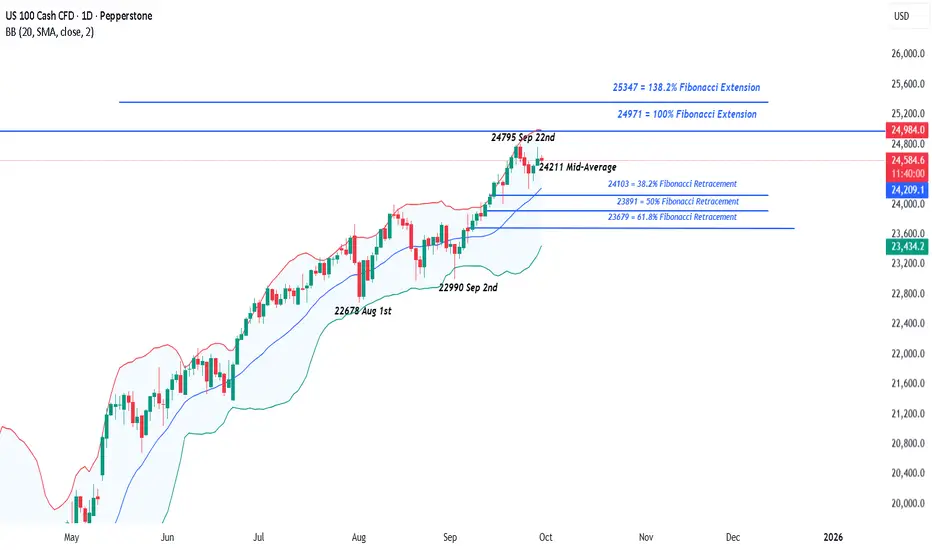
As the chart below shows, the latest price strength seen on Monday and into this morning, appears to be emerging from an initial support zone between 24211 and 24103. This range is marked by both the rising Bollinger mid-average and the 38.2% Fibonacci retracement of September’s advance.
A closing break below these levels wouldn’t confirm a downside shift but could pave the way for a test of 23891, the 50% retracement, and possibly even extend towards 23679, which is the 61.8% level.
Potential Resistance Levels:
After marking a new all-time high at 24795 on September 22nd, traders may now be monitoring this level as the initial resistance focus this week.
If the positive trend does remain, fresh attempts at price strength are possible. It could be worthwhile monitoring how the 24795 all-time high is defended on a closing basis, with successful breaks higher potentially leading to a further phase of price strength.
While a closing break above 24795 doesn’t guarantee further upside, it could trigger fresh attempts to push first towards 24971, the 100% Fibonacci extension, and potentially up to 25347, the 138.2% extension level.
The material provided here has not been prepared accordance with legal requirements designed to promote the independence of investment research and as such is considered to be a marketing communication. Whilst it is not subject to any prohibition on dealing ahead of the dissemination of investment research, we will not seek to take any advantage before providing it to our clients.
Pepperstone doesn’t represent that the material provided here is accurate, current or complete, and therefore shouldn’t be relied upon as such. The information, whether from a third party or not, isn’t to be considered as a recommendation; or an offer to buy or sell; or the solicitation of an offer to buy or sell any security, financial product or instrument; or to participate in any particular trading strategy. It does not take into account readers’ financial situation or investment objectives. We advise any readers of this content to seek their own advice. Without the approval of Pepperstone, reproduction or redistribution of this information isn’t permitted.
It seems that last week’s dip may have been driven by some profit taking into the end of what has been a strong third quarter performance for this technology heavy index (8%, July 1st to September 26th). That drop has already been unwound by yesterday’s 0.4% rally which has continued this morning to current levels around 24640 (0730 BST), as traders’ position for some key economic data on the US labour market, which could clear up whether the Fed has room to cut interest rates again when they meet next on October 29th.
While there is a US labour market data release scheduled for every day across the remainder of this week, the focus could be Friday’s Payrolls update, where traders are anticipating a modest gain of around 39k and the unemployment rate to remain at its current level of 4.3%. Any deviation from these expectations could impact the market’s pricing of around a 90% chance of an October Fed rate cut, and a 60% chance of another December rate cut, with knock on implications for the direction of the US 100 at the start of Q4.
One obstacle impacting Friday’s Payrolls could be the possibility for a US Federal government shutdown from October 1st, which could delay the release of the labour market data, creating an extra level of uncertainty into the end of the week. Congressional leaders met with President Trump at the White House yesterday and talks to avoid a shutdown are on-going, although the latest updates provided by Vice President Vance suggests that a funding agreement is still some way off.
It may be worthwhile monitoring progress on this throughout the day ahead, just in case an agreement isn’t reached, and it leads to some extra US 100 volatility.
Technical Update: Price Decline Finding Support
Price corrections are a natural part of a broader uptrend and often reflect a healthy reaction to recent upside extremes. Following last week’s sell-off in the US 100 index, traders may now be assessing whether the latest weakness is simply a limited pullback ahead of renewed attempts to extend what still appears to be a constructive trend, or the beginning of a more extended price decline.
While it’s impossible to confirm whether a renewed phase of strength is underway, last week’s initial weakness found support at lower levels. As the chart above shows, fresh upside attempts may now be emerging, suggesting the possibility of a resumption of the uptrend pattern.
While positive sentiment may still be evident, this week’s upcoming data releases could prove pivotal, with the potential to shift momentum and drive notable price moves across key assets and traders will be watching closely for confirmation, or disruption, of the current US 100 index trend.
As a result, it may be important to identify and then monitor key support and resistance levels in case an increased spell of volatility emerges.
Potential Support Levels:
As the chart below shows, the latest price strength seen on Monday and into this morning, appears to be emerging from an initial support zone between 24211 and 24103. This range is marked by both the rising Bollinger mid-average and the 38.2% Fibonacci retracement of September’s advance.
A closing break below these levels wouldn’t confirm a downside shift but could pave the way for a test of 23891, the 50% retracement, and possibly even extend towards 23679, which is the 61.8% level.
Potential Resistance Levels:
After marking a new all-time high at 24795 on September 22nd, traders may now be monitoring this level as the initial resistance focus this week.
If the positive trend does remain, fresh attempts at price strength are possible. It could be worthwhile monitoring how the 24795 all-time high is defended on a closing basis, with successful breaks higher potentially leading to a further phase of price strength.
While a closing break above 24795 doesn’t guarantee further upside, it could trigger fresh attempts to push first towards 24971, the 100% Fibonacci extension, and potentially up to 25347, the 138.2% extension level.
The material provided here has not been prepared accordance with legal requirements designed to promote the independence of investment research and as such is considered to be a marketing communication. Whilst it is not subject to any prohibition on dealing ahead of the dissemination of investment research, we will not seek to take any advantage before providing it to our clients.
Pepperstone doesn’t represent that the material provided here is accurate, current or complete, and therefore shouldn’t be relied upon as such. The information, whether from a third party or not, isn’t to be considered as a recommendation; or an offer to buy or sell; or the solicitation of an offer to buy or sell any security, financial product or instrument; or to participate in any particular trading strategy. It does not take into account readers’ financial situation or investment objectives. We advise any readers of this content to seek their own advice. Without the approval of Pepperstone, reproduction or redistribution of this information isn’t permitted.
Global risk Warning CFDs are complex instruments and come with a high risk of losing money rapidly due to leverage. Between 74-89% of retail investor accounts lose money when trading in CFDs. You should consider whether you understand how CFD
คำจำกัดสิทธิ์ความรับผิดชอบ
ข้อมูลและบทความไม่ได้มีวัตถุประสงค์เพื่อก่อให้เกิดกิจกรรมทางการเงิน, การลงทุน, การซื้อขาย, ข้อเสนอแนะ หรือคำแนะนำประเภทอื่น ๆ ที่ให้หรือรับรองโดย TradingView อ่านเพิ่มเติมที่ ข้อกำหนดการใช้งาน