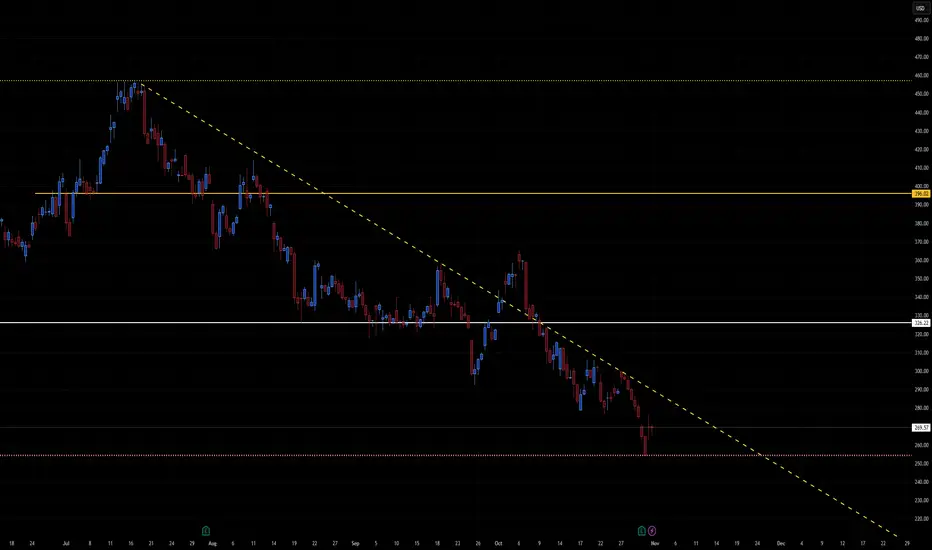
A long-term descending trendline (yellow dashed line) acting as dynamic resistance since July highs.
Major horizontal support around 265 USD (recent low and yellow dotted line).
Resistance levels near 325 USD and 395–400 USD.
Overall pattern: extended downtrend with lower highs and lower lows, but price nearing a strong confluence zone (trendline + horizontal support).
This setup suggests MSTR is in a make-or-break area — either a short-term reversal bounce or continuation to new lows.
📈 Bullish Scenario
Setup:
Price has reached oversold levels near 265, aligning with historical support. A technical bounce is possible if Bitcoin stabilizes or rallies, given MSTR’s correlation.
Confirmation Triggers:
Close above 280–285 USD (short-term confirmation).
Break and close above descending trendline (~295–300).
Short-Term Targets:
325 USD — former support turned resistance.
395–400 USD — key horizontal level and top of prior range.
Bullish Catalysts:
Bitcoin recovery or strength toward $70K+.
Institutional or ETF-related flows benefiting BTC proxies.
Technical short-covering rally.
Invalidation:
Daily close below 260 USD with strong volume.
Probability: Moderate (~40%), as reversal setups often require confirmation after long downtrends.
📉 Bearish Scenario
Setup:
Price continues to respect descending resistance and fails to reclaim 285–295 zone, maintaining downward momentum.
Confirmation Triggers:
Breakdown below 265 USD support.
Expansion in sell volume below that level.
Short-Term Targets:
250–255 USD → minor horizontal level (recent pivot area).
230–235 USD → next structural support.
210–215 USD → measured move from current descending channel.
Bearish Catalysts:
Bitcoin correction below $65K.
Continued macro tightening or risk-off environment.
Market rejection of BTC-linked equities.
Invalidation:
Breakout above 300 USD with sustained buying pressure.
Probability: Slightly higher (~60%) as trend remains clearly bearish.
⚖️ Neutral / Accumulation View
If MSTR remains range-bound between 265 and 300, this indicates accumulation before next major move.
Expect choppy price action with short squeezes and weak rallies until a breakout direction emerges.
🧩 Summary Table
Bias Confirmation Target Zone Invalidation Notes
Bullish Close > 300 325 → 395 <260 Trendline breakout
Bearish Close < 265 250 → 230 >300 Trend continuation
Neutral Range 265–300 — — Sideways accumulation
🕒 2–3 Week Projection
Bullish path: Bounce from 265 → breakout above 300 → target 325–330 by mid-November.
Bearish path: Fail at 285–295 → breakdown below 265 → slide to 235 by mid/late November.
คำจำกัดสิทธิ์ความรับผิดชอบ
ข้อมูลและบทความไม่ได้มีวัตถุประสงค์เพื่อก่อให้เกิดกิจกรรมทางการเงิน, การลงทุน, การซื้อขาย, ข้อเสนอแนะ หรือคำแนะนำประเภทอื่น ๆ ที่ให้หรือรับรองโดย TradingView อ่านเพิ่มเติมที่ ข้อกำหนดการใช้งาน
คำจำกัดสิทธิ์ความรับผิดชอบ
ข้อมูลและบทความไม่ได้มีวัตถุประสงค์เพื่อก่อให้เกิดกิจกรรมทางการเงิน, การลงทุน, การซื้อขาย, ข้อเสนอแนะ หรือคำแนะนำประเภทอื่น ๆ ที่ให้หรือรับรองโดย TradingView อ่านเพิ่มเติมที่ ข้อกำหนดการใช้งาน