🔎 Overview
____________________________________________________________
📔 Concept
____________________________________________________________
📌 How to Use
____________________________________________________________
📊 Chart Explanation
____________________________________________________________
👀 Observation
____________________________________________________________
💡 Conclusion
___________________________________________________________
⚠️ Disclaimer
The Bearish Engulfing Pattern is a strong two-candle reversal formation that signals a potential shift from an uptrend to a downtrend.
It occurs when a small bullish (green) candle is immediately followed by a large bearish (red) candle that completely engulfs the prior candle’s body.
This shows a clear shift in market psychology — buyers initially push the price higher, but sellers step in with force and erase those gains, marking the start of bearish momentum.
____________________________________________________________
📔 Concept
A Bearish Engulfing occurs when:
1️⃣ The first candle is a small green candle continuing the uptrend.
2️⃣ The next candle is a large red candle whose body completely engulfs the green candle’s body.
3️⃣ This pattern signals that sellers have regained control after buyer exhaustion.
____________________________________________________________
📌 How to Use
✅ Validation → The candle must close below the open of the red candle to confirm bearish reversal.
❌ Devalidation → If price closes above the close of the red candle before validation, the signal fails.
This structured confirmation helps filter false breakouts and define clear risk levels.
____________________________________________________________
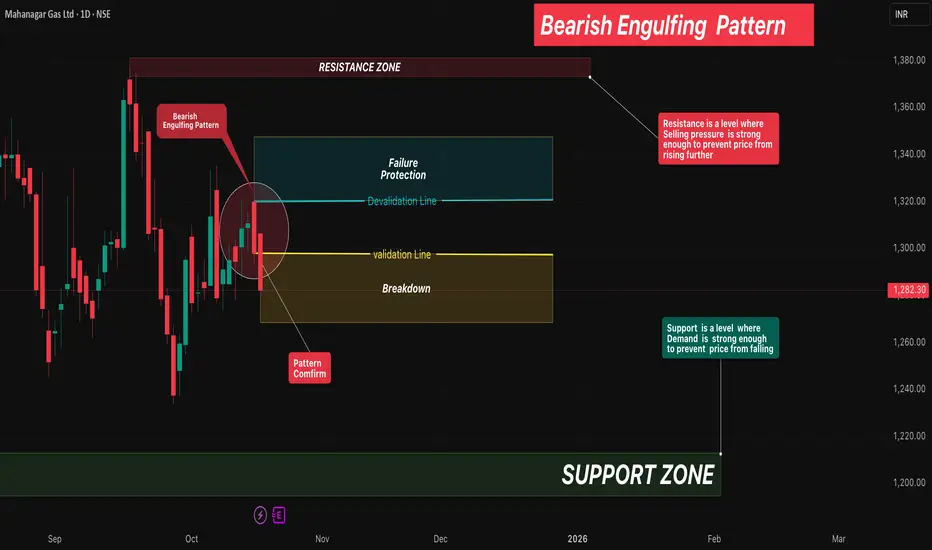
📊 Chart Explanation
• Symbol →MGL
• Timeframe → 1D
• On 15 Oct 2025, a small green candle formed, continuing the uptrend.
• On 16 Oct 2025, a large red candle engulfed the previous green body — confirming the Bearish Engulfing Pattern.
• On 17 Oct 2025, price broke down further, validating the bearish reversal.
This sequence highlights how quickly market sentiment shifted from bullish to bearish control.
____________________________________________________________
👀 Observation
• The Bearish Engulfing is most reliable near swing highs or resistance zones.
• High volume on the engulfing candle strengthens the reversal signal.
• Combining this pattern with confirmation tools like RSI, Supertrend, or Moving Averages
improves accuracy.
____________________________________________________________
💡 Conclusion
The Bearish Engulfing Pattern marks a clear shift in control from buyers to sellers.
Once validated, it indicates a high-probability reversal setup with defined stop-lose and target zones based on structure or risk-reward multiples.
___________________________________________________________
⚠️ Disclaimer
📘 For educational purposes only.
🙅 Not SEBI registered.
❌ Not a buy/sell recommendation.
🧠 Purely a learning resource.
📊 Not Financial Advice.
คำจำกัดสิทธิ์ความรับผิดชอบ
ข้อมูลและบทความไม่ได้มีวัตถุประสงค์เพื่อก่อให้เกิดกิจกรรมทางการเงิน, การลงทุน, การซื้อขาย, ข้อเสนอแนะ หรือคำแนะนำประเภทอื่น ๆ ที่ให้หรือรับรองโดย TradingView อ่านเพิ่มเติมใน ข้อกำหนดการใช้งาน
คำจำกัดสิทธิ์ความรับผิดชอบ
ข้อมูลและบทความไม่ได้มีวัตถุประสงค์เพื่อก่อให้เกิดกิจกรรมทางการเงิน, การลงทุน, การซื้อขาย, ข้อเสนอแนะ หรือคำแนะนำประเภทอื่น ๆ ที่ให้หรือรับรองโดย TradingView อ่านเพิ่มเติมใน ข้อกำหนดการใช้งาน