Here’s a **detailed analysis** of the Marine Electricals Ltd. chart you shared:
---
### **Chart Pattern & Setup:**
✅ **VCP Pattern**:
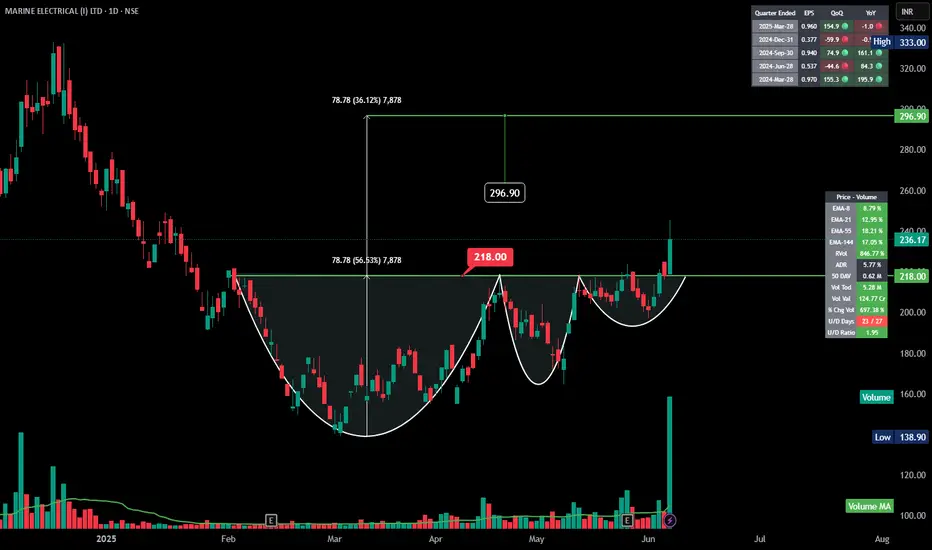
* Well-formed **VCP *218 ** level, as indicated.
---
### **Measured Move & Target:**
* Depth of cup = **78.78 ** (\~36.12% move).
* **Target after breakout:**
Breakout Level (218) + Depth (78.78) = 296.90
---
### **Volume Confirmation:**
✅ Huge surge in volume on breakout day, reinforcing the bullish breakout.
✅ Volume expansion is above moving average, a positive sign.
---
### **Key Technical Levels:**
* **Breakout level:** 218
* **Current price:** 236.17
* **Resistance/Target:** 296.90
* **Support:** 218 (former resistance now turned support).
---
### **Momentum & Indicators:**
✅ All key EMAs (8, 21, 55, 144) are upward sloping – confirming a **bullish trend**.
✅ Fundamental earnings data show significant YoY growth – another positive factor.
---
### **Trade Idea & Risk Management:**
📈 The breakout suggests a target of **\~296 **.
📉 A close below **218 ** would invalidate the pattern—consider this as a stop-loss level for risk management.
---
### **Chart Pattern & Setup:**
✅ **VCP Pattern**:
* Well-formed **VCP *218 ** level, as indicated.
---
### **Measured Move & Target:**
* Depth of cup = **78.78 ** (\~36.12% move).
* **Target after breakout:**
Breakout Level (218) + Depth (78.78) = 296.90
---
### **Volume Confirmation:**
✅ Huge surge in volume on breakout day, reinforcing the bullish breakout.
✅ Volume expansion is above moving average, a positive sign.
---
### **Key Technical Levels:**
* **Breakout level:** 218
* **Current price:** 236.17
* **Resistance/Target:** 296.90
* **Support:** 218 (former resistance now turned support).
---
### **Momentum & Indicators:**
✅ All key EMAs (8, 21, 55, 144) are upward sloping – confirming a **bullish trend**.
✅ Fundamental earnings data show significant YoY growth – another positive factor.
---
### **Trade Idea & Risk Management:**
📈 The breakout suggests a target of **\~296 **.
📉 A close below **218 ** would invalidate the pattern—consider this as a stop-loss level for risk management.
คำจำกัดสิทธิ์ความรับผิดชอบ
ข้อมูลและบทความไม่ได้มีวัตถุประสงค์เพื่อก่อให้เกิดกิจกรรมทางการเงิน, การลงทุน, การซื้อขาย, ข้อเสนอแนะ หรือคำแนะนำประเภทอื่น ๆ ที่ให้หรือรับรองโดย TradingView อ่านเพิ่มเติมใน ข้อกำหนดการใช้งาน
คำจำกัดสิทธิ์ความรับผิดชอบ
ข้อมูลและบทความไม่ได้มีวัตถุประสงค์เพื่อก่อให้เกิดกิจกรรมทางการเงิน, การลงทุน, การซื้อขาย, ข้อเสนอแนะ หรือคำแนะนำประเภทอื่น ๆ ที่ให้หรือรับรองโดย TradingView อ่านเพิ่มเติมใน ข้อกำหนดการใช้งาน