1. Executive Summary
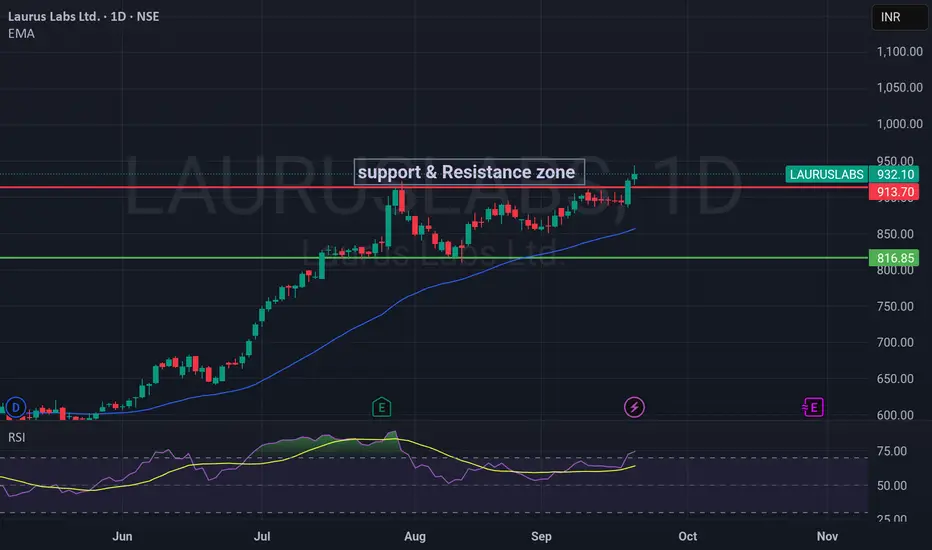
Laurus Labs is in a strong bullish momentum phase, trading well above its key Exponential Moving Average (EMA). The stock faces a decisive resistance at 950. A breakout above this level could signal the next leg up, while the trend remains supported on any pullback towards the 856-917 zone. The high RSI suggests caution for immediate entries; prefer buying on dips.
2. Key Technical Observations:
Price Action: The stock closed positively at 932.10 (+0.96%), near the day's high of 944, indicating strong buying interest at lower levels.
Trend Analysis: The price is trading significantly above the EMA (856.88), confirming a robust medium-term UPTREND.
Momentum (RSI): The RSI is at 74.73, indicating the stock is in OVERBOUGHT territory. This suggests the possibility of a short-term consolidation or pullback before the next potential move higher.
Key Levels:
Resistance: 950 (Immediate & Crucial)
Support: 917 (Today's Low) -> 856 (EMA & Strong Trend Support)
3. Trading Plan:
Bullish Scenario (Primary Bias):
Entry Trigger 1 (Aggressive): A breakout and sustained close above 950 with high volume.
Entry Trigger 2 (Conservative): A pullback towards the support zone between 917 - 870 (ideally near the 856 EMA) for a better risk-reward entry.
Stop-Loss: Below 850 (A break below the EMA would invalidate the bullish structure).
Target 1: 1000
Target 2: 1025 - 1050
Bearish Scenario (Caution Signal):
A break below the 856 EMA support could lead to a deeper correction towards 800.
This is not the primary expectation but a key level to watch for risk management.
คำจำกัดสิทธิ์ความรับผิดชอบ
ข้อมูลและบทความไม่ได้มีวัตถุประสงค์เพื่อก่อให้เกิดกิจกรรมทางการเงิน, การลงทุน, การซื้อขาย, ข้อเสนอแนะ หรือคำแนะนำประเภทอื่น ๆ ที่ให้หรือรับรองโดย TradingView อ่านเพิ่มเติมที่ ข้อกำหนดการใช้งาน
คำจำกัดสิทธิ์ความรับผิดชอบ
ข้อมูลและบทความไม่ได้มีวัตถุประสงค์เพื่อก่อให้เกิดกิจกรรมทางการเงิน, การลงทุน, การซื้อขาย, ข้อเสนอแนะ หรือคำแนะนำประเภทอื่น ๆ ที่ให้หรือรับรองโดย TradingView อ่านเพิ่มเติมที่ ข้อกำหนดการใช้งาน