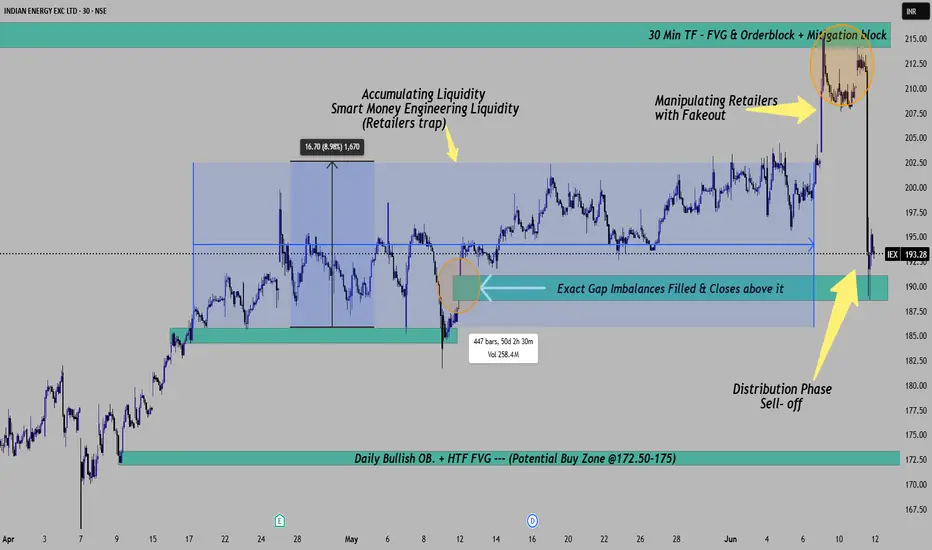
Indian Energy Exc Ltd.
I tried to analyze deeply how and why Smart money gave this fall and reason behind this.
Timeframe used here is --- 30 min
Here i saw Power of 3 concepts, Accumulation, Manipulation and Distribution
I would like to discuss in short about the happening in the share price ---
1. Accumulation phase ---
Multiple Liquidity sweeps and consolidation formed a retailer's trap between 185-201 levels
(It took 50 days into consolidation and hovered in 15 points {185-200} )
2. Manipulation phase ----
Retailers trapped during the breakout followed by a fake out reversal.
Price made 2 times rejection from 30 min time frame FVG + Order block levels
3. Distribution phase -----
Price started rejecting HTF POI and started sharp sell-off.
Here we can understand that smart money exited positions and made sell-off.
Also, we see today price made a low exact at the level where Gap Imbalance was created.
here we can also see that, today in a single day price moved from 214 to 188.
Anything rests, Explained in the chart itself.
Expectation for next move ----Potential upside from 172-175 levels.
(Views are only for educational purpose. Do not consider it as an investments planning.)
การนำเสนอที่เกี่ยวข้อง
คำจำกัดสิทธิ์ความรับผิดชอบ
ข้อมูลและบทความไม่ได้มีวัตถุประสงค์เพื่อก่อให้เกิดกิจกรรมทางการเงิน, การลงทุน, การซื้อขาย, ข้อเสนอแนะ หรือคำแนะนำประเภทอื่น ๆ ที่ให้หรือรับรองโดย TradingView อ่านเพิ่มเติมที่ ข้อกำหนดการใช้งาน
การนำเสนอที่เกี่ยวข้อง
คำจำกัดสิทธิ์ความรับผิดชอบ
ข้อมูลและบทความไม่ได้มีวัตถุประสงค์เพื่อก่อให้เกิดกิจกรรมทางการเงิน, การลงทุน, การซื้อขาย, ข้อเสนอแนะ หรือคำแนะนำประเภทอื่น ๆ ที่ให้หรือรับรองโดย TradingView อ่านเพิ่มเติมที่ ข้อกำหนดการใช้งาน