เพิ่มขึ้น
Is a time for HIPPOUSDT? Potential 50% - 0.0028 USD CRYPTO
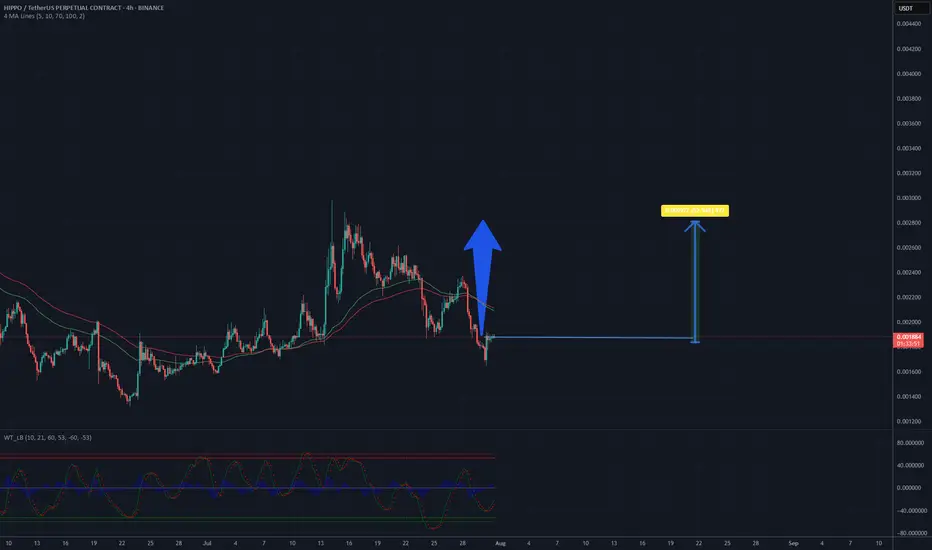
The chart displays a 4-hour candlestick pattern for the HIPPO/USDT perpetual contract on Binance, showing price movements from late June to mid-September 2025. The price has recently experienced a downward trend after reaching a peak, with a noticeable drop from around 0.0028 to the current level of approximately 0.00186. The moving averages (red and green lines) indicate a potential bearish crossover, suggesting continued downward pressure in the short term. However, the price is approaching a support level near 0.0017, where historical buying interest might emerge. The oscillator at the bottom shows mixed signals, with a slight uptick that could hint at a potential reversal if momentum builds. Based on this analysis, a price recovery to 0.0028 seems plausible if the support holds and buying volume increases in the coming sessions.
Potential TP: 0.0028 USD
Potential TP: 0.0028 USD
คำจำกัดสิทธิ์ความรับผิดชอบ
ข้อมูลและบทความไม่ได้มีวัตถุประสงค์เพื่อก่อให้เกิดกิจกรรมทางการเงิน, การลงทุน, การซื้อขาย, ข้อเสนอแนะ หรือคำแนะนำประเภทอื่น ๆ ที่ให้หรือรับรองโดย TradingView อ่านเพิ่มเติมใน ข้อกำหนดการใช้งาน
คำจำกัดสิทธิ์ความรับผิดชอบ
ข้อมูลและบทความไม่ได้มีวัตถุประสงค์เพื่อก่อให้เกิดกิจกรรมทางการเงิน, การลงทุน, การซื้อขาย, ข้อเสนอแนะ หรือคำแนะนำประเภทอื่น ๆ ที่ให้หรือรับรองโดย TradingView อ่านเพิ่มเติมใน ข้อกำหนดการใช้งาน