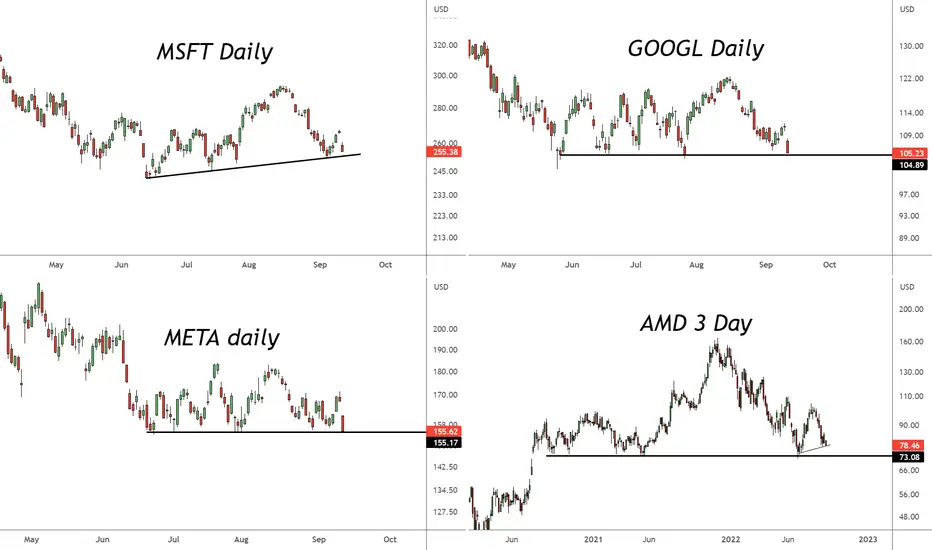
These four big tech stocks are on thin ice.
A break of these necklines suggests more downside. These levels likely indicate around 11,900 on the Nasdaq as the line in the sand.
Question is, does this lead to capitulation or a longer duration downtrend. TBD...
Nasdaq 11,900 level = red line

A break of these necklines suggests more downside. These levels likely indicate around 11,900 on the Nasdaq as the line in the sand.
Question is, does this lead to capitulation or a longer duration downtrend. TBD...
Nasdaq 11,900 level = red line
บันทึก
MSFT potential magnet and buy zone:GOOGL:
Will likely be better buying opportunities on stocks with better RS, but watch these levels for next major support on the Nasdaq if reached around the same time
คำจำกัดสิทธิ์ความรับผิดชอบ
ข้อมูลและบทความไม่ได้มีวัตถุประสงค์เพื่อก่อให้เกิดกิจกรรมทางการเงิน, การลงทุน, การซื้อขาย, ข้อเสนอแนะ หรือคำแนะนำประเภทอื่น ๆ ที่ให้หรือรับรองโดย TradingView อ่านเพิ่มเติมใน ข้อกำหนดการใช้งาน
คำจำกัดสิทธิ์ความรับผิดชอบ
ข้อมูลและบทความไม่ได้มีวัตถุประสงค์เพื่อก่อให้เกิดกิจกรรมทางการเงิน, การลงทุน, การซื้อขาย, ข้อเสนอแนะ หรือคำแนะนำประเภทอื่น ๆ ที่ให้หรือรับรองโดย TradingView อ่านเพิ่มเติมใน ข้อกำหนดการใช้งาน