🟡 1. Chart Title
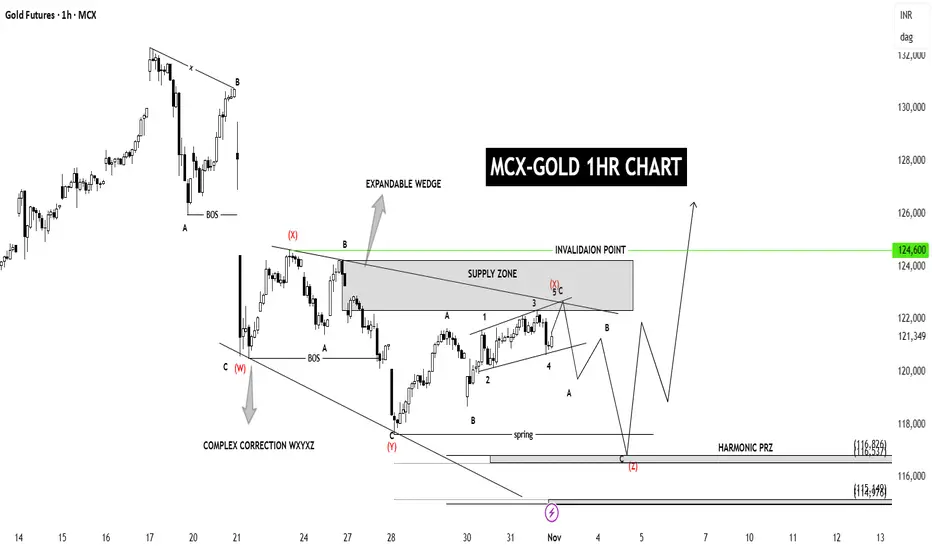
“MCX-GOLD 1HR CHART” — This means the analysis is based on each candle representing 1 hour of price action.
⸻
⚙ 2. Structure Breakdown
• Complex Correction (W–X–Y–X–Z):
This shows that gold has been in a corrective phase, not an impulsive move.
The correction is labeled as a WXYXZ structure — a complex sideways/downward correction with multiple swings.
• Expandable Wedge:
The pattern shows an expanding shape, meaning each swing is getting slightly larger.
This is a sign of high volatility and often forms before a major breakout.
⸻
⚫ 3. Key Zones
• Supply Zone (around ₹124,000–₹124,600):
This is where sellers are expected to enter the market, possibly pushing the price down again.
• Invalidation Point (₹124,600):
If the price goes above ₹124,600, this current bearish correction view is invalidated, and a bullish breakout could start.
• Harmonic PRZ (Potential Reversal Zone):
Located around ₹116,800 – ₹113,400, marked at the bottom of the chart.
This is a buy zone (demand area) based on harmonic projection — expecting the price to reverse upward from this region.
⸻
🔁 4. Elliott Wave Labels
• Current correction labeled as Wave (4) —
After completion, a strong Wave (5) impulse upward is expected.
• Sub-waves (a–b–c) are drawn within the correction to show smaller internal movements.
⸻
📉 5. Expected Move
The chart shows two possible paths:
1. Short-term bearish move —
Price may fall from the supply zone (~₹122,000–₹124,000) to the harmonic PRZ around ₹117,000.
2. Then bullish reversal —
From the PRZ, the chart expects a strong upside rally, possibly toward ₹126,000+.
คำจำกัดสิทธิ์ความรับผิดชอบ
ข้อมูลและบทความไม่ได้มีวัตถุประสงค์เพื่อก่อให้เกิดกิจกรรมทางการเงิน, การลงทุน, การซื้อขาย, ข้อเสนอแนะ หรือคำแนะนำประเภทอื่น ๆ ที่ให้หรือรับรองโดย TradingView อ่านเพิ่มเติมที่ ข้อกำหนดการใช้งาน
คำจำกัดสิทธิ์ความรับผิดชอบ
ข้อมูลและบทความไม่ได้มีวัตถุประสงค์เพื่อก่อให้เกิดกิจกรรมทางการเงิน, การลงทุน, การซื้อขาย, ข้อเสนอแนะ หรือคำแนะนำประเภทอื่น ๆ ที่ให้หรือรับรองโดย TradingView อ่านเพิ่มเติมที่ ข้อกำหนดการใช้งาน