Bearish Trend Expected within Ascending Channel"
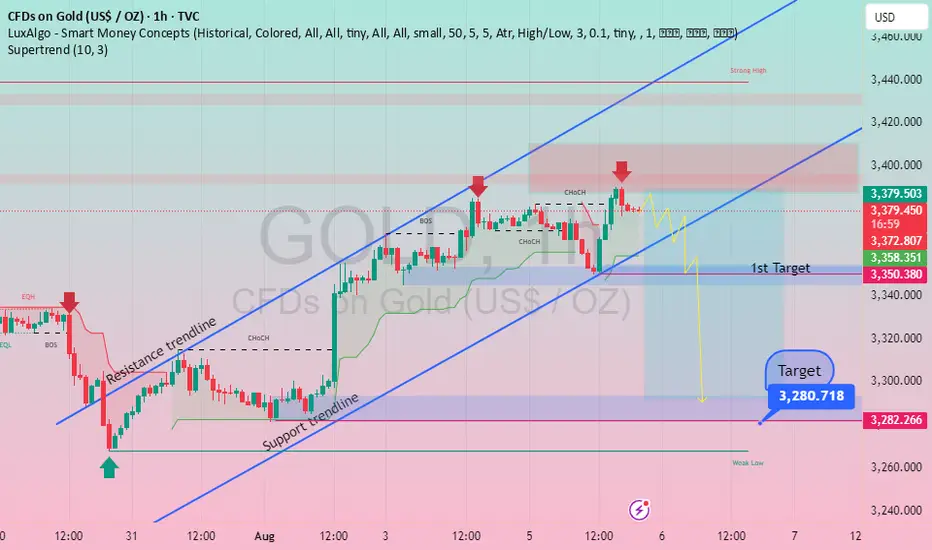
The chart you've shared appears to be a technical analysis of the price of Gold in US Dollars per ounce (USD/OZ) on a 1-hour timeframe, as indicated by the "1h" in the top-left corner of the chart. The chart is annotated with various technical indicators and trend lines, suggesting a potential trading strategy.
Here's a breakdown of the key elements visible on the chart:
1. Trend Lines: The chart features two blue trend lines that form an ascending channel. The lower blue line is labeled as the "Support trendline," and the upper blue line is labeled as the "Resistance trendline." This indicates that the price of Gold is currently trading within this ascending channel.
2. Price Movement: The price has been moving upwards within this channel, touching the resistance line multiple times and then pulling back to the support line. The most recent price action shows the price touching the resistance line and then starting to move downwards.
3. Annotations: There are red arrows pointing downwards at the points where the price touched the resistance line and started to move down. This suggests that the annotator expects the price to continue moving downwards.
4. Targets: The chart is annotated with two targets: "1st Target" at approximately 3,358.351 USD/OZ and "Target" at 3,280.718 USD/OZ. These targets are likely based on the expectation that the price will continue to move downwards within the channel.
5. Supertrend Indicator: The Supertrend indicator is shown at 3,358.351 with a circle, indicating a potential sell signal or a point of interest for traders.
Given this information, the chart analysis suggests a bearish outlook for the price of Gold in the short term, with expectations of a downward move towards the target prices. The use of the ascending channel and the Supertrend indicator provides a framework for understanding the potential price movement.
To provide discretion on the chart, it's essential to consider the following:
- The price is currently at the resistance line of the ascending channel, which could lead to a downward correction.
- The targets are set based on the support levels within the channel, suggesting a potential downward move.
- The Supertrend indicator is providing a sell signal, aligning with the bearish outlook.
However, it's crucial to note that technical analysis is not a guarantee of future price movements. Various market factors, including economic indicators, geopolitical events, and market sentiment, can influence the price of Gold.
If you're considering trading based on this analysis, it's recommended to:
- Verify the analysis with other technical and fundamental indicators.
- Set appropriate stop-loss levels to manage risk.
- Stay updated with market news and events that could impact the price of Gold.
Do you have any specific questions about this chart analysis or would you like further clarification on any of the elements mentioned?
คำจำกัดสิทธิ์ความรับผิดชอบ
ข้อมูลและบทความไม่ได้มีวัตถุประสงค์เพื่อก่อให้เกิดกิจกรรมทางการเงิน, การลงทุน, การซื้อขาย, ข้อเสนอแนะ หรือคำแนะนำประเภทอื่น ๆ ที่ให้หรือรับรองโดย TradingView อ่านเพิ่มเติมที่ ข้อกำหนดการใช้งาน
คำจำกัดสิทธิ์ความรับผิดชอบ
ข้อมูลและบทความไม่ได้มีวัตถุประสงค์เพื่อก่อให้เกิดกิจกรรมทางการเงิน, การลงทุน, การซื้อขาย, ข้อเสนอแนะ หรือคำแนะนำประเภทอื่น ๆ ที่ให้หรือรับรองโดย TradingView อ่านเพิ่มเติมที่ ข้อกำหนดการใช้งาน