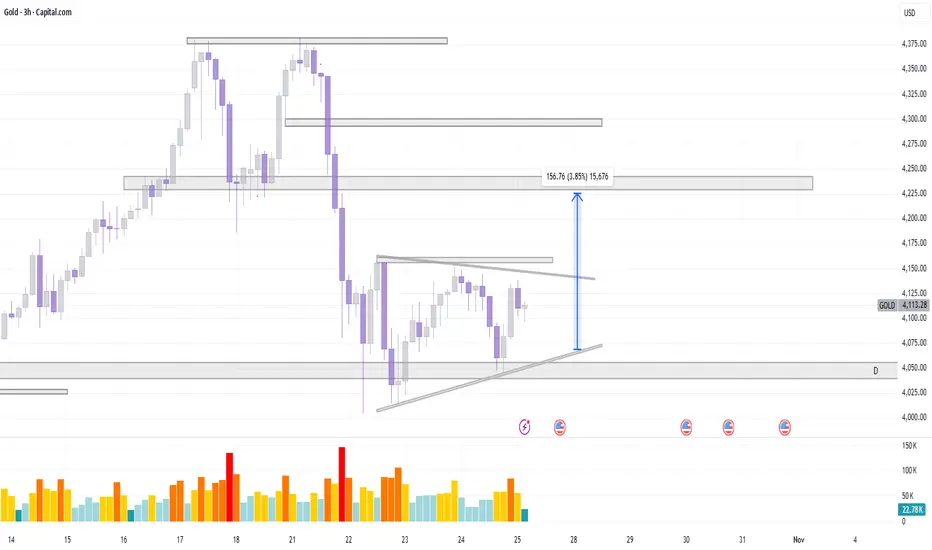
The chart displays a recent uptrend followed by a period of consolidation, which has formed a symmetrical triangle pattern.
Key Observations:
Prior Trend and Break of Structure (BOS): The price was in a strong uptrend, reaching a high near the $4,400 level. A subsequent drop broke a recent low, marked as a Break of Structure (BOS) near $4,025, which often signals a potential shift in the short-term market structure from bullish to more neutral or bearish.
Consolidation Pattern: Following the drop, the price has entered a consolidation phase, trading within a symmetrical triangle pattern (highlighted by the converging dashed lines). This pattern typically suggests indecision between buyers and sellers and is often a continuation or reversal pattern depending on the breakout direction.
The price is currently resting near the bottom of this triangle around $4,113.
Support and Resistance Zones:
Strong Support (Demand): The area around $4,025 to $4,050 is a critical support zone (marked as 'D' for Demand and the BOS line). A breakdown below this level could trigger further selling.
Resistance (Supply): There are multiple overhead supply zones (marked by the horizontal gray/white boxes) that the price needs to clear. The immediate key resistance zone is the price level that forms the top boundary of the triangle.
คำจำกัดสิทธิ์ความรับผิดชอบ
ข้อมูลและบทความไม่ได้มีวัตถุประสงค์เพื่อก่อให้เกิดกิจกรรมทางการเงิน, การลงทุน, การซื้อขาย, ข้อเสนอแนะ หรือคำแนะนำประเภทอื่น ๆ ที่ให้หรือรับรองโดย TradingView อ่านเพิ่มเติมที่ ข้อกำหนดการใช้งาน
คำจำกัดสิทธิ์ความรับผิดชอบ
ข้อมูลและบทความไม่ได้มีวัตถุประสงค์เพื่อก่อให้เกิดกิจกรรมทางการเงิน, การลงทุน, การซื้อขาย, ข้อเสนอแนะ หรือคำแนะนำประเภทอื่น ๆ ที่ให้หรือรับรองโดย TradingView อ่านเพิ่มเติมที่ ข้อกำหนดการใช้งาน