Hello 🐋
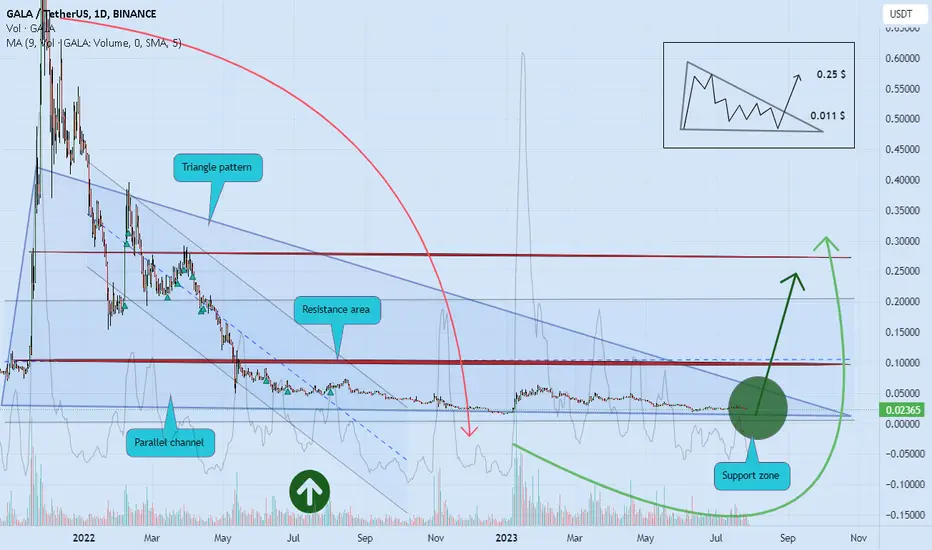
Based on the chart, the price is in the parallel channel and close to the channel support area, and triangle pattern ✔️
if
the price doesn't break the support zone to the downside, we will see more gain 💣🚀
otherwise
we can see more correction to lower support level ❌🧨
if
breakout of the upper resistance zone be completed, we can see more pump to the upside ✔️🚀
👌 Notice: pay attention to the price on shortcut chart (located below the main chart with black colour) 📖💡
Please, feel free to share your point of view, write it in the comments below, thanks 🐋
Educational plans & Free signals, all in telegram:
👉t.me/madwhalechannel
👉t.me/madwhalechannel
คำจำกัดสิทธิ์ความรับผิดชอบ
ข้อมูลและบทความไม่ได้มีวัตถุประสงค์เพื่อก่อให้เกิดกิจกรรมทางการเงิน, การลงทุน, การซื้อขาย, ข้อเสนอแนะ หรือคำแนะนำประเภทอื่น ๆ ที่ให้หรือรับรองโดย TradingView อ่านเพิ่มเติมใน ข้อกำหนดการใช้งาน