✅ Closing Summary:
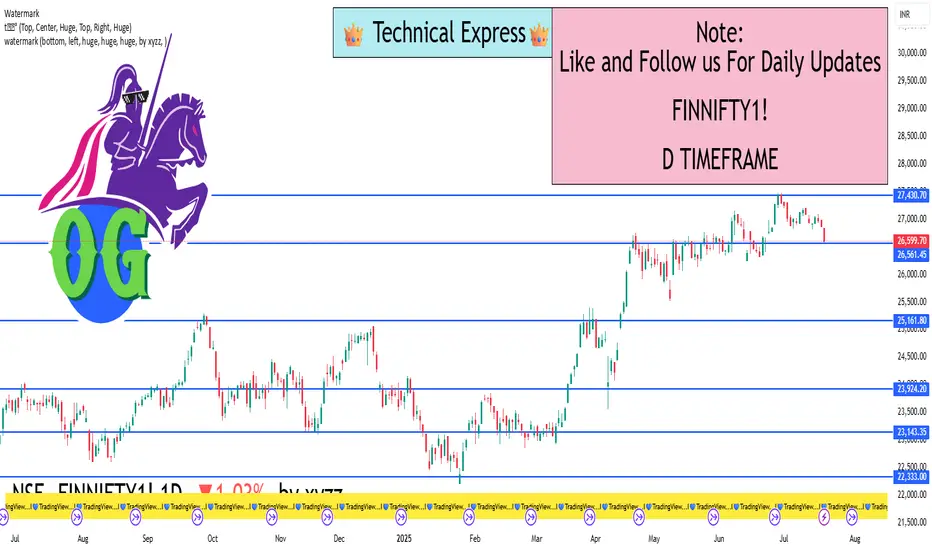
Closing Price: ₹26,556.15
Change: −₹253.30 (−0.94%)
Opening Price: ₹26,809.45
Intraday High: ₹26,785.35
Intraday Low: ₹26,513.80
The FinNifty index saw a sharp drop today, primarily driven by weakness in key financial stocks and negative investor sentiment.
🔍 Key Reasons for the Decline:
Banking Sector Weakness:
One of the biggest drags was a major bank (e.g., Axis Bank) that reported weaker-than-expected quarterly earnings.
This led to panic selling in other banking and financial institutions as well.
Foreign Institutional Investors (FII) Selling:
Significant outflows from FIIs contributed to the negative sentiment.
Investors remained cautious ahead of upcoming major earnings reports and global cues.
Global Market Pressure:
Concerns about U.S. interest rate policies, inflation data, and global recessionary fears kept the broader financial market under pressure.
Psychological Level Break:
The index broke key psychological support around ₹26,600, triggering technical selling and increased volatility.
📈 Technical Outlook (Short-Term):
Support Zone: ₹26,500 to ₹26,400
This area provided some buying interest during the day, but a break below could open doors to ₹26,200 or lower.
Resistance Zone: ₹26,750 to ₹26,900
This region needs to be reclaimed for any positive momentum to sustain.
Momentum Indicators:
RSI (Relative Strength Index): Trending downward, approaching oversold conditions (~38–42).
MACD (Moving Average Convergence Divergence): Showing bearish crossover, confirming short-term weakness.
Volume: Above average during the sell-off, suggesting institutional participation in the decline.
📆 Recent Trend Performance:
1-Day Return: −0.94%
1-Week Return: −0.65%
1-Month Return: +1.35%
6-Month Return: +18.6%
1-Year Return: +13.4%
Despite the daily fall, the medium-to-long-term trend remains bullish, supported by overall strong fundamentals and earnings growth expectations.
🧠 What Traders & Investors Should Know:
Short-Term Traders: Should be cautious. Look for a bounce near the support zone for short-covering opportunities or fresh entries with tight stop-losses.
Swing Traders: May wait for confirmation of support holding at ₹26,500 before considering long trades.
Long-Term Investors: The decline could be seen as a healthy correction in an otherwise strong uptrend. Ideal for staggered buying in quality financial stocks.
💬 Conclusion:
FinNifty is currently experiencing short-term pressure due to earnings misses, global uncertainty, and FII outflows. However, its long-term chart remains constructive. Today’s 1-day candle represents a bearish move, but unless ₹26,400 breaks decisively, a recovery is possible in the coming sessions—especially if upcoming results from top banks like HDFC and ICICI meet or exceed expectations
I built a Buy & Sell Signal Indicator with 85% accuracy.
📈 Get access via DM or
WhatsApp: wa.link/d997q0
| Email: techncialexpress@gmail.com
| Script Coder | Trader | Investor | From India
📈 Get access via DM or
WhatsApp: wa.link/d997q0
| Email: techncialexpress@gmail.com
| Script Coder | Trader | Investor | From India
การนำเสนอที่เกี่ยวข้อง
คำจำกัดสิทธิ์ความรับผิดชอบ
ข้อมูลและบทความไม่ได้มีวัตถุประสงค์เพื่อก่อให้เกิดกิจกรรมทางการเงิน, การลงทุน, การซื้อขาย, ข้อเสนอแนะ หรือคำแนะนำประเภทอื่น ๆ ที่ให้หรือรับรองโดย TradingView อ่านเพิ่มเติมที่ ข้อกำหนดการใช้งาน