This technical indicator will help you to avoid every fakeout on Forex, Gold or any other market and will accurately confirm a valid support or resistance violation.
It is absolutely free and it is available on TradingView, MetaTrader 4/5 or any other trading terminal.
This indicator is very easy to use, and you can set it up in just 1 click.
Discover a proven way to identify traps.
This technical indicator is called On Balance Volume.
To add that to your chart simply open indicators window on TradingView and search it.
By clicking on that, it will immediately start working.
You can find it on the bottom of the chart.
And here is what this free indicator does:
On forex market, this indicator measures tick volume - the number of a price change for a certain period.
Then it compares a current price close with a previous one.
If a current price is higher than previous, it takes a previous volume and adds that to a current volume, making the indicator rise.
If a current price is lower than previous, it takes a previous volume and subtracts a current volume from that, making the indicator fall.
If a current price is the same as the previous, the indicator remains unchanged.
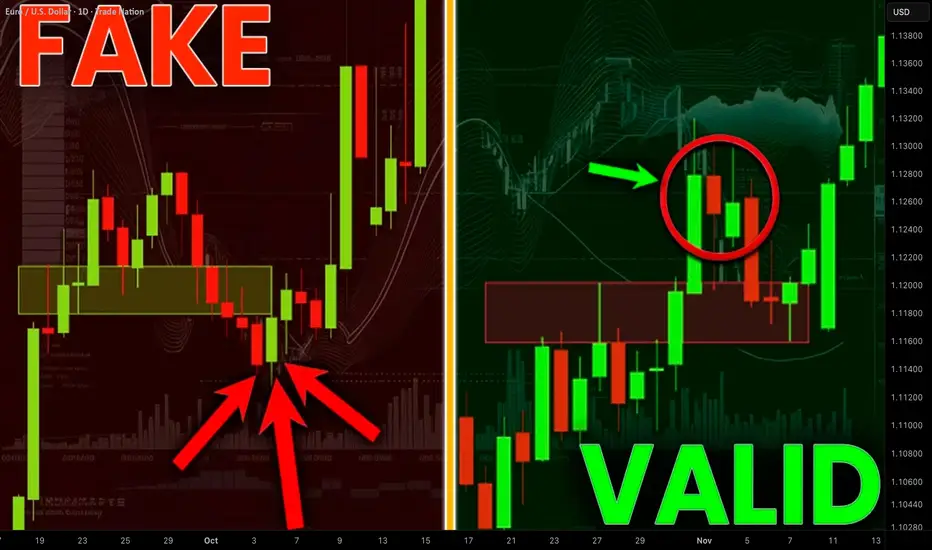
And that indicator can be used to spot fakeouts and traps.
The idea is that valid bullish and bearish breakouts should be accompanied by volume spikes.
If price breaks resistance but OBV doesn’t make a new high, it’s likely a fake breakout. Because a violation occurs with low volumes.
Examine a breakout candle of a horizontal resistance on EURUSD forex pair.
The market successfully closed above that.
On balance volume set a new higher high, confirming a strength of this up movement.
The market continued rising then.
Now compare a previous breakdown to a bullish violation of a resistance area on AUDUSD.
Though, a candle close above that, the indicator sets a lower high, creating a divergence.
It indicates a price manipulation by smart money.
And this breakout was false and On Balance Volume helped us to predict that.
Now let's study bearish breakouts and fakeouts.
A key horizontal support was broken on USDJPY forex pair.
A bearish candle successfully closed below that.
On Balance Volume confirms this bearish violation by a formation of a new local Lower Low.
It signifies that this breakout occurred with a spike of selling activity.
And the price went way lower then.
A bearish violation of a support cluster on NZDCAD is not confirmed by On Balance Volume.
While a candle successfully closed below the underlined area, the indicator sets a Higher Low.
That is an important warning that this violation can be a fakeout.
You can see that it was a bearish trap.
Smart money were manipulating the market, making the price violate that support. The absence of a selling volumes spike suggested that.
As you can see, this indicator is very simple to use.
Integrate that in your trading plan.
It will dramatically increase the accuracy of your breakout trading and fakeout avoidance.
It will help you find traps and expose manipulations.
❤️Please, support my work with like, thank you!❤️
I am part of Trade Nation's Influencer program and receive a monthly fee for using their TradingView charts in my analysis.
บันทึก
Check my new educational article:
✅Join My Telegram Channel: t.me/VasilyTrading
❗️YouTube Channel youtube.com/c/VasilyTrader
✅ Facebook: facebook.com/VasilyTrading/
⭐ My Forex & Gold Broker: bit.ly/vasilyforexbroker ⭐
❗️YouTube Channel youtube.com/c/VasilyTrader
✅ Facebook: facebook.com/VasilyTrading/
⭐ My Forex & Gold Broker: bit.ly/vasilyforexbroker ⭐
การนำเสนอที่เกี่ยวข้อง
คำจำกัดสิทธิ์ความรับผิดชอบ
ข้อมูลและบทความไม่ได้มีวัตถุประสงค์เพื่อก่อให้เกิดกิจกรรมทางการเงิน, การลงทุน, การซื้อขาย, ข้อเสนอแนะ หรือคำแนะนำประเภทอื่น ๆ ที่ให้หรือรับรองโดย TradingView อ่านเพิ่มเติมที่ ข้อกำหนดการใช้งาน