🚨 ETH Elliott Wave Update 🚨
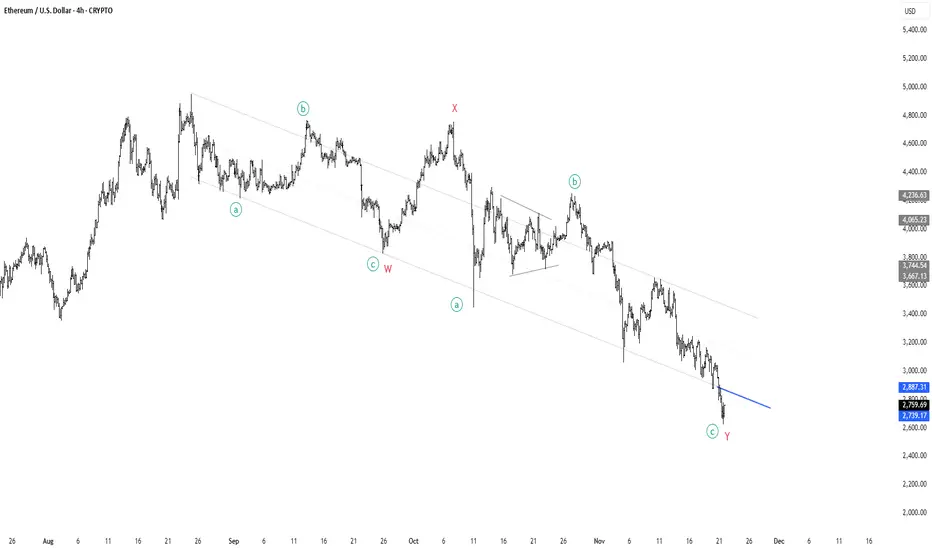
What we’re looking at here is a clean W-X-Y complex correction unfolding over months — a classic structure when the market wants to correct deeper without breaking the macro trend.
• Wave W completed with an ABC decline
• Wave X gave us the relief rally everyone thought was the bottom ❌
• Wave Y extended lower, subdividing into a-b-c, pulling price into the lower boundary of the corrective channel
Now we’re sitting right at the end of minor wave c of Y, the final leg of this entire structure. The pattern is mature, sellers look exhausted, and the downtrend channel is tightening — perfect conditions for a potential reversal.
🔵 The blue trendline is the key.
If ETH can punch through that level with momentum, it confirms the entire WXY correction is complete and opens the door for a major impulsive leg upward.
💥 Break the blue line → reclaim macro structure →
I believe ETH will begin the march toward new all-time highs.
This is where long-term bottoms historically form:
deep structure, clean proportions, fading downside velocity, and a clear invalidation level.
📈 Eyes on the breakout.
บันทึก
All eyes on the blue line. คำจำกัดสิทธิ์ความรับผิดชอบ
ข้อมูลและบทความไม่ได้มีวัตถุประสงค์เพื่อก่อให้เกิดกิจกรรมทางการเงิน, การลงทุน, การซื้อขาย, ข้อเสนอแนะ หรือคำแนะนำประเภทอื่น ๆ ที่ให้หรือรับรองโดย TradingView อ่านเพิ่มเติมใน ข้อกำหนดการใช้งาน
คำจำกัดสิทธิ์ความรับผิดชอบ
ข้อมูลและบทความไม่ได้มีวัตถุประสงค์เพื่อก่อให้เกิดกิจกรรมทางการเงิน, การลงทุน, การซื้อขาย, ข้อเสนอแนะ หรือคำแนะนำประเภทอื่น ๆ ที่ให้หรือรับรองโดย TradingView อ่านเพิ่มเติมใน ข้อกำหนดการใช้งาน