Overview: let's review a few key points of the update of yesterday:
Update: I have to repeat one more point from the previous updates: "the price action is nicely following our expectations."!
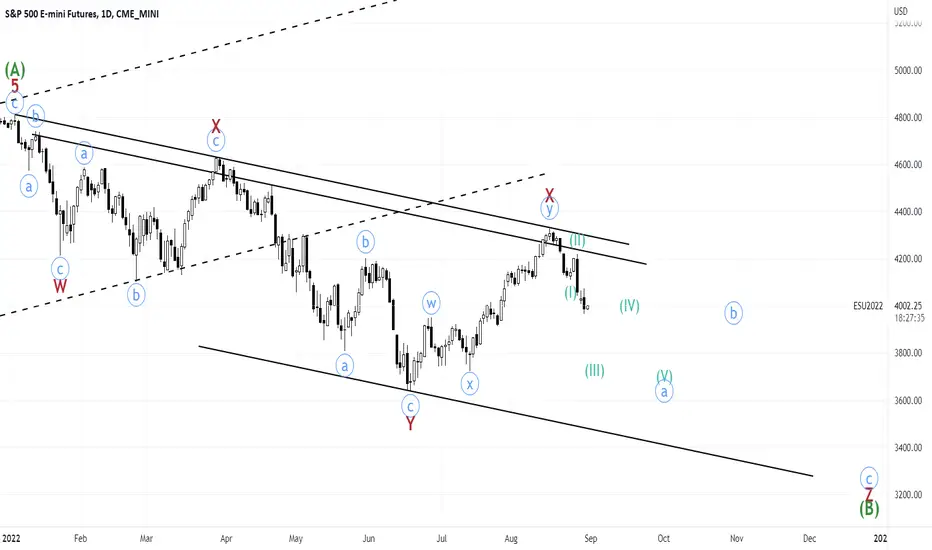
Let's look at the hourly chart:
In wave b of (III), we formed a lower low as the second wave X, then peaked at 4072.75 and finally broke the upward channel decisively.
Now, I believe today we formed wave 1 of c of (III).

What is my target for wave 2 of c of (III)?
Let's go to the 15 min chart: it seems the market loves to make nested wxyxz corrections and head & shoulders on this bearish phase.
There are 4 ways to have an idea of what can be wave 2 peak (4028-4031.5):
1) Retracement of wave 1 of c of (III): 4009.25, 4018.75, 4028, 4031.5, and 4036.75
2) Volume profile of wave 1 of c of (III): based on the volume profile, we can consider these targets: 4020.25, 4032.75 (note that these two numbers are not exact)

3) The price target of the head & shoulder pattern: 4026

4) Support and resistance levels: 4017, 4029.25, and 4039.75

Finally, this is the structure of wave 2 of c of (III):

- I believe wave b is not complete yet and I expect it to turn into a triple zigzag retesting 4076.75 area.
- If we break the upward channel decisively, then wave b is complete and we have started wave c of (III).
- Note that based on the price target of the head & shoulders pattern, I believe the second wave X is yet to be complete as shown on the 5-min chart.
Update: I have to repeat one more point from the previous updates: "the price action is nicely following our expectations."!
Let's look at the hourly chart:
In wave b of (III), we formed a lower low as the second wave X, then peaked at 4072.75 and finally broke the upward channel decisively.
Now, I believe today we formed wave 1 of c of (III).
What is my target for wave 2 of c of (III)?
Let's go to the 15 min chart: it seems the market loves to make nested wxyxz corrections and head & shoulders on this bearish phase.
There are 4 ways to have an idea of what can be wave 2 peak (4028-4031.5):
1) Retracement of wave 1 of c of (III): 4009.25, 4018.75, 4028, 4031.5, and 4036.75
2) Volume profile of wave 1 of c of (III): based on the volume profile, we can consider these targets: 4020.25, 4032.75 (note that these two numbers are not exact)
3) The price target of the head & shoulder pattern: 4026
4) Support and resistance levels: 4017, 4029.25, and 4039.75
Finally, this is the structure of wave 2 of c of (III):
การนำเสนอที่เกี่ยวข้อง
คำจำกัดสิทธิ์ความรับผิดชอบ
ข้อมูลและบทความไม่ได้มีวัตถุประสงค์เพื่อก่อให้เกิดกิจกรรมทางการเงิน, การลงทุน, การซื้อขาย, ข้อเสนอแนะ หรือคำแนะนำประเภทอื่น ๆ ที่ให้หรือรับรองโดย TradingView อ่านเพิ่มเติมใน ข้อกำหนดการใช้งาน
การนำเสนอที่เกี่ยวข้อง
คำจำกัดสิทธิ์ความรับผิดชอบ
ข้อมูลและบทความไม่ได้มีวัตถุประสงค์เพื่อก่อให้เกิดกิจกรรมทางการเงิน, การลงทุน, การซื้อขาย, ข้อเสนอแนะ หรือคำแนะนำประเภทอื่น ๆ ที่ให้หรือรับรองโดย TradingView อ่านเพิ่มเติมใน ข้อกำหนดการใช้งาน