Hi everyone,
I did not publish a new idea on ES yesterday, since the price action was following the expected path perfectly and I only added the following update to the idea of August 12th:

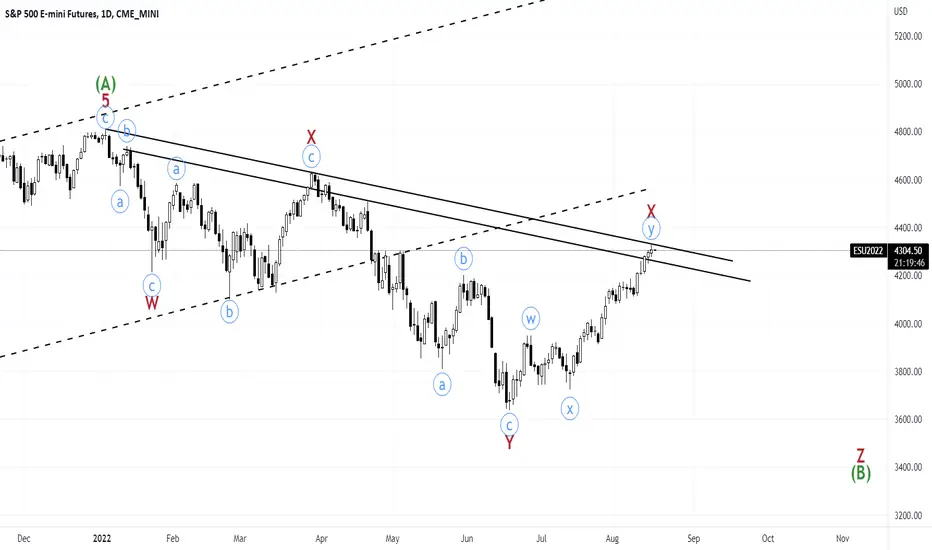
Overview: since August 11th, we were expecting that we are in wave V of (c) of y of X. As a potential target for wave X peak, I refer to my August 11th update: "Right now, I see us extending in wave V of (c) of y of X. Potential targets for wave X peak (4290-4310)."
Update: I believe that market peaked today. What is my reasoning for this claim?
Note: in case that wave V of (c) of y of X is still not completed and we make a higher high, I don't expect that high to be more than 4340 (I am considering a very low chance for this scenario at the moment.)
The only reason that I am considering this scenario is based on the hourly chart of appl, where I am still expecting a higher high on that name. This can lead to the same thing that happened on March 30th, 2022, where aapl made a higher high in that day, while spy did not.
I did not publish a new idea on ES yesterday, since the price action was following the expected path perfectly and I only added the following update to the idea of August 12th:
Overview: since August 11th, we were expecting that we are in wave V of (c) of y of X. As a potential target for wave X peak, I refer to my August 11th update: "Right now, I see us extending in wave V of (c) of y of X. Potential targets for wave X peak (4290-4310)."
Update: I believe that market peaked today. What is my reasoning for this claim?
- The same hourly count that I was updating since August 11th is now showing a complete structure for wave V of (c) of y of X.
- The high of today was 4327.5, which is aligned with several fib ratios: for example, a target for wave (5) was 4329.75 or a price target for wave C was 4329.
- The 200SMA on the daily chart can act as a strong pivot, which was at 4322.44 today and rejected the price nicely.
Note: in case that wave V of (c) of y of X is still not completed and we make a higher high, I don't expect that high to be more than 4340 (I am considering a very low chance for this scenario at the moment.)
The only reason that I am considering this scenario is based on the hourly chart of appl, where I am still expecting a higher high on that name. This can lead to the same thing that happened on March 30th, 2022, where aapl made a higher high in that day, while spy did not.
การนำเสนอที่เกี่ยวข้อง
คำจำกัดสิทธิ์ความรับผิดชอบ
ข้อมูลและบทความไม่ได้มีวัตถุประสงค์เพื่อก่อให้เกิดกิจกรรมทางการเงิน, การลงทุน, การซื้อขาย, ข้อเสนอแนะ หรือคำแนะนำประเภทอื่น ๆ ที่ให้หรือรับรองโดย TradingView อ่านเพิ่มเติมใน ข้อกำหนดการใช้งาน
การนำเสนอที่เกี่ยวข้อง
คำจำกัดสิทธิ์ความรับผิดชอบ
ข้อมูลและบทความไม่ได้มีวัตถุประสงค์เพื่อก่อให้เกิดกิจกรรมทางการเงิน, การลงทุน, การซื้อขาย, ข้อเสนอแนะ หรือคำแนะนำประเภทอื่น ๆ ที่ให้หรือรับรองโดย TradingView อ่านเพิ่มเติมใน ข้อกำหนดการใช้งาน
