1. Pattern Analysis
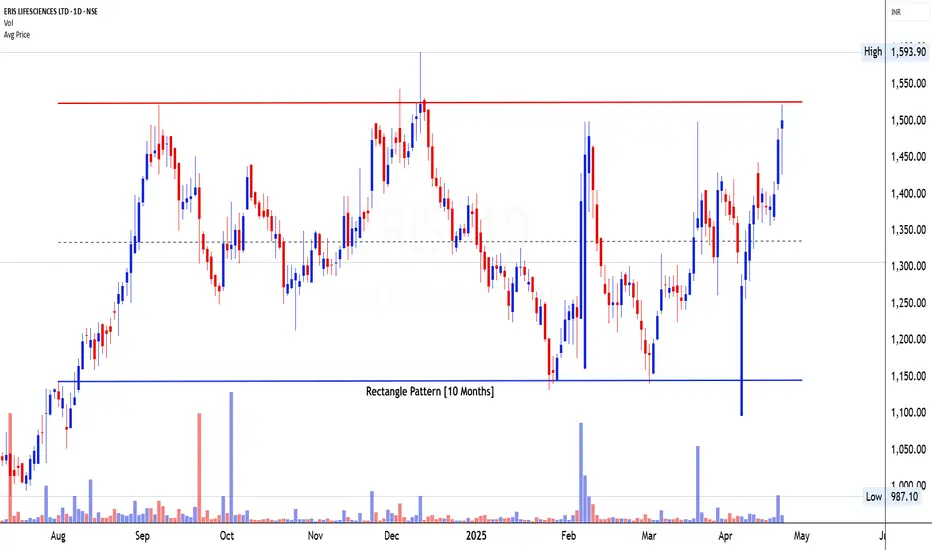
ERIS Lifesciences is currently presenting a compelling bullish structure through the formation of a Rectangle Pattern that has evolved over a 10-month period. This horizontal consolidation structure is formed by consistent reactions from the upper resistance zone around ₹1,510 and lower support near ₹1,130. These two parallel horizontal levels have served as critical price barriers over the past several months, indicating a phase of accumulation and range-bound action.
The price has now approached the upper boundary of the rectangle, currently testing the resistance zone. The significance of this pattern lies in its duration—10 months—which makes it a tradable setup per technical analysis standards. Once the breakout from the ₹1,510 level is confirmed with strong volume, it would mark the beginning of a fresh leg higher, signaling the end of the consolidation phase and the start of a trend continuation pattern.
2. Volume Analysis
Volume behavior over the course of the pattern formation has played a confirming role. During the earlier part of the rectangle, volume remained muted and cyclic. However, as the price approached the upper resistance in recent weeks, a noticeable surge in volume has occurred. This volume increase during the upside movements is particularly bullish, as it suggests that institutional players are beginning to participate and potentially accumulate positions ahead of a breakout.
The most recent daily candles, especially those pushing toward the ₹1,510 resistance, are supported by high volume bars. This indicates that the breakout attempt is being driven by genuine demand rather than speculative movement. Volume expansion during a resistance test is typically considered a positive sign and often precedes a successful breakout when followed by follow-through price action.
3. Candlestick / Price Analysis
The candlestick structure on the daily timeframe shows a series of strong bullish candles with wide ranges and minimal upper wicks. These candles demonstrate persistent buying strength and strong intraday follow-through. The consistent presence of bullish marubozu and long-body candles with strong closes near daily highs suggests that buyers are in firm control.
Notably, the recent price move has been sharp and vertical from the lower support of the rectangle, forming a “V-shaped recovery” within the pattern. This kind of price response typically indicates aggressive buying interest at lower levels, building toward a potential breakout above the established resistance. The price structure shows strength not just in momentum but in the conviction of buyers who are stepping in earlier in the session and holding their positions through to the close.
4. Validation of Signal
The alignment between price action, volume behavior, and candlestick structure provides a strong validation for the potential bullish breakout from the rectangle pattern. The pattern’s 10-month duration gives it weight in terms of technical reliability. With price currently less than 1% away from the resistance zone at ₹1,510, a confirmed breakout above this level—especially if supported by another strong volume spike—would signal a transition from consolidation to a new trend phase.
The lack of supply near the upper edge of the rectangle and the steep momentum behind the recent rally further strengthen the case for a breakout. If price sustains above ₹1,510 on a closing basis, it would not only complete the rectangle breakout but also create fresh bullish territory with no major overhead resistance until higher levels.
5. Tradable Points Determination
Entry Point Determination
The ideal entry point would be on a confirmed breakout above the ₹1,510 resistance level. A daily close above this zone with follow-up buying in subsequent sessions will act as confirmation. Conservative traders may wait for a retest of the breakout zone to enter, while aggressive traders can consider pre-breakout positioning above ₹1,500 with a tight stop.
Target Point Determination
Based on the height of the rectangle pattern (₹1,510 - ₹1,130 = ₹380), we derive our breakout target by adding this height to the breakout level:
Target 1: ₹1,620 – minor target for quick swing traders.
Target 2: ₹1,750 – the projected pattern breakout target based on rectangle height.
Target 3: ₹1,900 – a long-term target derived from the previous swing high region and momentum extension zone.
Stop Loss Placement and Trailing SL Follow-up
An initial stop loss should be placed just below ₹1,440, which marks the last minor consolidation zone and is close to the average price level seen within the rectangle. For position traders, a wider stop at ₹1,390 (just below the recent rally base) can be considered for higher confidence.
Once price sustains above ₹1,550–₹1,570, traders should consider trailing their stop loss higher. A logical step would be:
Move SL to ₹1,480 after the first 5% move
Then trail to ₹1,510 after price touches ₹1,620
Finally, lock in profits as the move toward ₹1,750 and ₹1,900 unfolds.
Learn Today for Better Tomorrow
คำจำกัดสิทธิ์ความรับผิดชอบ
ข้อมูลและบทความไม่ได้มีวัตถุประสงค์เพื่อก่อให้เกิดกิจกรรมทางการเงิน, การลงทุน, การซื้อขาย, ข้อเสนอแนะ หรือคำแนะนำประเภทอื่น ๆ ที่ให้หรือรับรองโดย TradingView อ่านเพิ่มเติมที่ ข้อกำหนดการใช้งาน
Learn Today for Better Tomorrow
คำจำกัดสิทธิ์ความรับผิดชอบ
ข้อมูลและบทความไม่ได้มีวัตถุประสงค์เพื่อก่อให้เกิดกิจกรรมทางการเงิน, การลงทุน, การซื้อขาย, ข้อเสนอแนะ หรือคำแนะนำประเภทอื่น ๆ ที่ให้หรือรับรองโดย TradingView อ่านเพิ่มเติมที่ ข้อกำหนดการใช้งาน