Topic Statement:
Dixon has rebounded strongly in line with the broader market rally but now approaches critical resistance levels that may cap further upside.
Key Points:
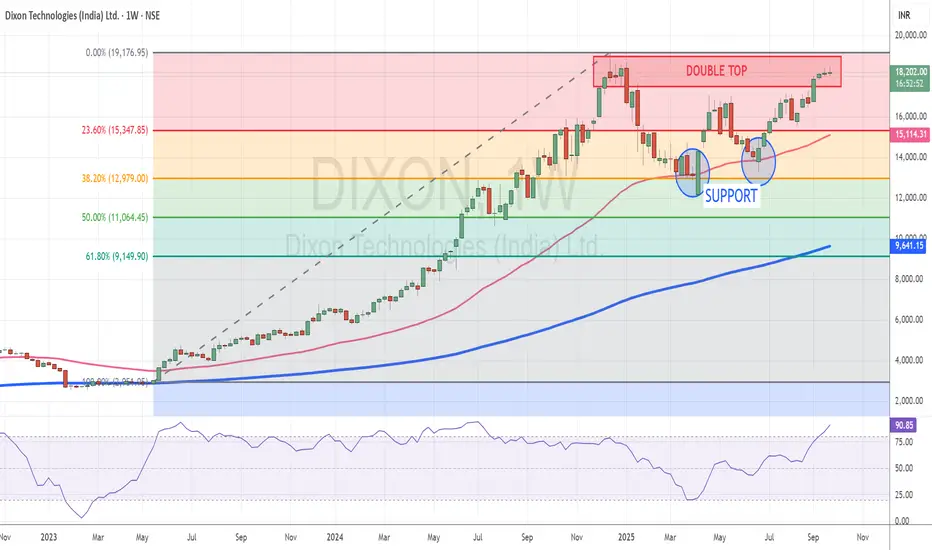
1. The stock retraced to the 38.2% Fibonacci level where it found strong support and resumed its upward move
2. The 50-day EMA acted as a deflection point, offering additional support during the recovery
3. Price is now at its lifetime high near the 18,000 mark, where a double top candlestick pattern is forming
4. The double top indicates significant resistance, making it a potential shorting opportunity unless a breakout confirms further bullishness
Dixon has rebounded strongly in line with the broader market rally but now approaches critical resistance levels that may cap further upside.
Key Points:
1. The stock retraced to the 38.2% Fibonacci level where it found strong support and resumed its upward move
2. The 50-day EMA acted as a deflection point, offering additional support during the recovery
3. Price is now at its lifetime high near the 18,000 mark, where a double top candlestick pattern is forming
4. The double top indicates significant resistance, making it a potential shorting opportunity unless a breakout confirms further bullishness
คำจำกัดสิทธิ์ความรับผิดชอบ
ข้อมูลและบทความไม่ได้มีวัตถุประสงค์เพื่อก่อให้เกิดกิจกรรมทางการเงิน, การลงทุน, การซื้อขาย, ข้อเสนอแนะ หรือคำแนะนำประเภทอื่น ๆ ที่ให้หรือรับรองโดย TradingView อ่านเพิ่มเติมใน ข้อกำหนดการใช้งาน
คำจำกัดสิทธิ์ความรับผิดชอบ
ข้อมูลและบทความไม่ได้มีวัตถุประสงค์เพื่อก่อให้เกิดกิจกรรมทางการเงิน, การลงทุน, การซื้อขาย, ข้อเสนอแนะ หรือคำแนะนำประเภทอื่น ๆ ที่ให้หรือรับรองโดย TradingView อ่านเพิ่มเติมใน ข้อกำหนดการใช้งาน