Devyani Intl – Triangle Breakout Loading? 🚀
📊 Stock Analysis: Devyani International Ltd (NSE: DEYANI)
🔹 Technical Overview
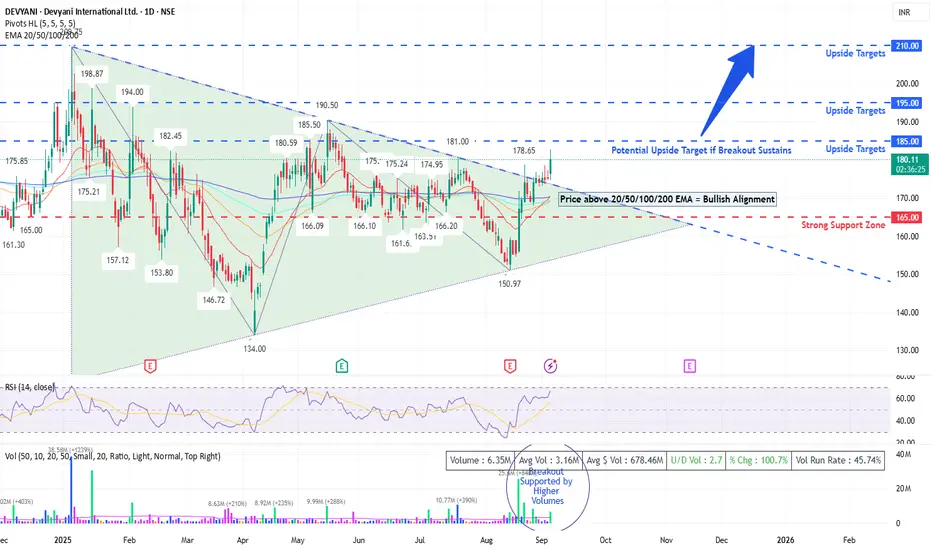
Pattern: Symmetrical Triangle breakout attempt visible on daily charts. Price has tested the upper resistance trendline multiple times (₹190–₹195 zone) and is now trading above short-term EMAs.
Key Support Levels: ₹165, ₹150
Immediate Resistance Levels: ₹185, ₹195 (major breakout zone)
Indicators:
RSI (14): 66.5 → Positive momentum, but near overbought levels.
EMA Cluster (20/50/100/200): Price trading above all key EMAs – strong short-term bullish signal.
Volume: Breakout supported with above-average volumes (5.3M vs 3.1M avg).
➡️ A sustained close above ₹185–₹190 could trigger a rally towards ₹200–₹210.
🔹 Fundamental Snapshot
Business Model: Devyani International Ltd is the largest franchisee of Yum! Brands in India, operating KFC, Pizza Hut, and Costa Coffee.
Growth Drivers:
Rapid store expansions (targeting Tier II/III cities).
Rising QSR demand in India with improving urban disposable income.
Long-term industry tailwinds in organized food retail.
Risks:
Margin pressures due to inflation in raw materials.
Intense competition in QSR space (Domino’s, McDonald’s, Burger King).
High dependence on discretionary consumer spending.
🔹 Trading Strategy
Short-Term (1–3 weeks): Buy on dips near ₹170–₹175, SL below ₹165. Target: ₹190 / ₹200.
Medium-Term (2–3 months): If breakout above ₹195 holds with volume, positional target can be ₹220+.
Risk Management: Keep SL below triangle support (₹160) for positional trades.
🔹 Sentiment & Outlook
📈 With improving consumer demand and strong expansion plans, Devyani remains a long-term growth story in India’s QSR sector. Current technical setup indicates a potential breakout rally if momentum sustains above ₹185–₹190.
⚡ Conclusion:
👉 Stock is at a make-or-break zone. Sustained move above ₹190 could unlock fresh highs, while failure may keep it in consolidation within the triangle.
📊 Stock Analysis: Devyani International Ltd (NSE: DEYANI)
🔹 Technical Overview
Pattern: Symmetrical Triangle breakout attempt visible on daily charts. Price has tested the upper resistance trendline multiple times (₹190–₹195 zone) and is now trading above short-term EMAs.
Key Support Levels: ₹165, ₹150
Immediate Resistance Levels: ₹185, ₹195 (major breakout zone)
Indicators:
RSI (14): 66.5 → Positive momentum, but near overbought levels.
EMA Cluster (20/50/100/200): Price trading above all key EMAs – strong short-term bullish signal.
Volume: Breakout supported with above-average volumes (5.3M vs 3.1M avg).
➡️ A sustained close above ₹185–₹190 could trigger a rally towards ₹200–₹210.
🔹 Fundamental Snapshot
Business Model: Devyani International Ltd is the largest franchisee of Yum! Brands in India, operating KFC, Pizza Hut, and Costa Coffee.
Growth Drivers:
Rapid store expansions (targeting Tier II/III cities).
Rising QSR demand in India with improving urban disposable income.
Long-term industry tailwinds in organized food retail.
Risks:
Margin pressures due to inflation in raw materials.
Intense competition in QSR space (Domino’s, McDonald’s, Burger King).
High dependence on discretionary consumer spending.
🔹 Trading Strategy
Short-Term (1–3 weeks): Buy on dips near ₹170–₹175, SL below ₹165. Target: ₹190 / ₹200.
Medium-Term (2–3 months): If breakout above ₹195 holds with volume, positional target can be ₹220+.
Risk Management: Keep SL below triangle support (₹160) for positional trades.
🔹 Sentiment & Outlook
📈 With improving consumer demand and strong expansion plans, Devyani remains a long-term growth story in India’s QSR sector. Current technical setup indicates a potential breakout rally if momentum sustains above ₹185–₹190.
⚡ Conclusion:
👉 Stock is at a make-or-break zone. Sustained move above ₹190 could unlock fresh highs, while failure may keep it in consolidation within the triangle.
คำจำกัดสิทธิ์ความรับผิดชอบ
ข้อมูลและบทความไม่ได้มีวัตถุประสงค์เพื่อก่อให้เกิดกิจกรรมทางการเงิน, การลงทุน, การซื้อขาย, ข้อเสนอแนะ หรือคำแนะนำประเภทอื่น ๆ ที่ให้หรือรับรองโดย TradingView อ่านเพิ่มเติมที่ ข้อกำหนดการใช้งาน
คำจำกัดสิทธิ์ความรับผิดชอบ
ข้อมูลและบทความไม่ได้มีวัตถุประสงค์เพื่อก่อให้เกิดกิจกรรมทางการเงิน, การลงทุน, การซื้อขาย, ข้อเสนอแนะ หรือคำแนะนำประเภทอื่น ๆ ที่ให้หรือรับรองโดย TradingView อ่านเพิ่มเติมที่ ข้อกำหนดการใช้งาน